Python 官方文档:入门教程 => 点击学习
目录一、seaborn概述二、数据整理01 折线图02 柱形图03 直方图三、绘图01 设定调色盘02 柱状图03 技术图04 点图05 箱型图06 小提琴图一、seaborn概述
Seaborn是在matplotlib的基础上进行了更高级的api封装,从而使得作图更加容易,在大多数情况下使用seaborn就能做出很具有吸引力的图。详情请查阅官网:seaborn
import seaborn as sns
import numpy as np
import matplotlib as mpl
from matplotlib import pyplot as plt
import pandas as pd
from datetime import datetime,timedelta
%matplotlib inline
plt.rcParams['font.sans-serif']=['SimHei'] # 用来正常显示中文标签
plt.rcParams['axes.unicode_minus']=False # 用来正常显示负号
from datetime import datetime
films=['穿过寒冬拥抱你','反贪风暴5:最终章','李茂扮太子','误杀2','以年为单位的恋爱','黑客帝国:矩阵重启','雄狮少年','魔法满屋','汪汪队立大功大电影','爱情神话']
regions=['中国','英国','澳大利亚','美国','美国','中国','英国','澳大利亚','美国','美国']
bos=['61,181','44,303','42,439','22,984','13,979','61,181','44,303','41,439','20,984','19,979']
persons=['31','23','56','17','9','31','23','56','17','9']
prices=['51','43','56','57','49','51','43','56','57','49']
showdate=['2022-12-03','2022-12-05','2022-12-01','2022-12-02','2022-11-05','2022-12-03','2022-12-05','2022-12-01','2022-12-02','2022-11-05']
ftypes=['剧情','动作','喜剧','剧情','剧情','爱情','动作','动画','动画','动画']
points=['8.1','9.0','7.9','6.7','3.8','8.1','9.0','7.9','6.7','3.8']
filmdescript={
    'ftypes':ftypes,
    'bos':bos,
    'prices':prices,
    'persons':persons,
    'regions':regions,
    'showdate':showdate,
    'points':points
}
import numpy as np
import pandas as pd
cnbo2021top5=pd.DataFrame(filmdescript,index=films)
cnbo2021top5[['prices','persons']]=cnbo2021top5[['prices','persons']].astype(int)
cnbo2021top5['bos']=cnbo2021top5['bos'].str.replace(',','').astype(int)
cnbo2021top5['showdate']=cnbo2021top5['showdate'].astype('datetime64')
cnbo2021top5['points']=cnbo2021top5['points'].apply(lambda x:float(x) if x!='' else 0)
cnbo2021top5

# 常用调色盘
r_hex = '#dc2624'     # red,       RGB = 220,38,36
dt_hex = '#2b4750'    # dark teal, RGB = 43,71,80
tl_hex = '#45a0a2'    # teal,      RGB = 69,160,162
r1_hex = '#e87a59'    # red,       RGB = 232,122,89
tl1_hex = '#7dcaa9'   # teal,      RGB = 125,202,169
g_hex = '#649E7D'     # green,     RGB = 100,158,125
o_hex = '#dc8018'     # orange,    RGB = 220,128,24
tn_hex = '#C89F91'    # tan,       RGB = 200,159,145
g50_hex = '#6c6d6c'   # grey-50,   RGB = 108,109,108
bg_hex = '#4f6268'    # blue grey, RGB = 79,98,104
g25_hex = '#c7cccf'   # grey-25,   RGB = 199,204,207
color=['#dc2624' ,'#2b4750','#45a0a2','#e87a59','#7dcaa9','#649E7D','#dc8018','#C89F91','#6c6d6c','#4f6268','#c7cccf']
sns.set_palette(color)
def sinplot(flip=1):
    x = np.linspace(0, 14, 100)
    for i in range(1, 7):
        plt.plot(x, np.sin(x + i * .5) * (7 - i) * flip)
sinplot()
# 对两种画图进行比较
fig = plt.figure()
sns.set()
sinplot()

plt.rcParams['font.sans-serif']=['SimHei'] # 用来正常显示中文标签
plt.rcParams['axes.unicode_minus']=False # 用来正常显示负号
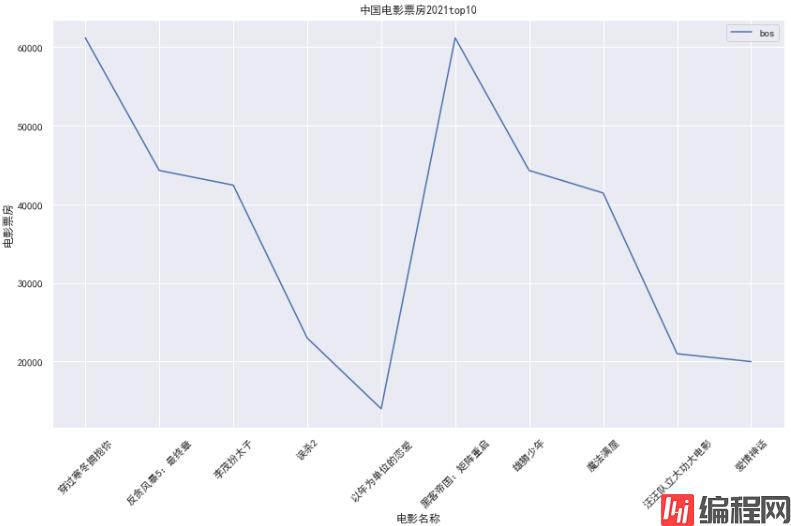
plt.figure(figsize=(14,8))
plt.title("中国电影票房2021top10")
plt.xlabel("电影名称")
plt.ylabel("电影票房")
sns.lineplot(data=cnbo2021top5[['bos']])
plt.xticks(rotation=45)
cnbo2021top5ftgb=cnbo2021top5.groupby(['ftypes'])['bos','persons','prices','points'].mean()
cnbo2021top5ftgb=cnbo2021top5ftgb.reset_index().replace()
cnbo2021top5ftgb

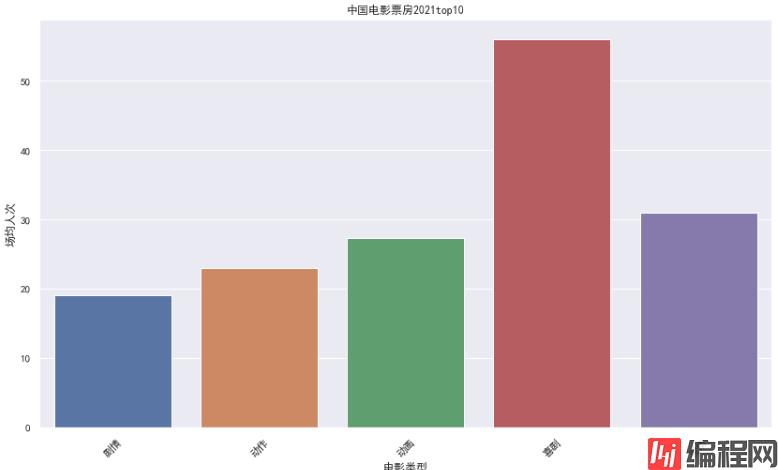
### 02 条形图
plt.figure(figsize=(14,8))
plt.title("中国电影票房2021top10")
sns.barplot(x=cnbo2021top5ftgb['ftypes'],y=cnbo2021top5ftgb['persons'])
plt.xlabel("电影类型")
plt.ylabel("场均人次")
plt.xticks(rotation=45)
plt.show()
### 03 直方图
plt.figure(figsize=(14,8))
plt.title("中国电影票房2021top10")
sns.histplot(x=cnbo2021top5['bos'],bins=15) # x=cnbo2021top5ftgb['ftypes'],y=cnbo2021top5ftgb['persons']
plt.xlabel("电影类型")
plt.ylabel("场均人次")
plt.xticks(rotation=45)
plt.show()

上面的数据只有十部电影,而下面的数据是我整理出来的电影数据:
excel:300部电影数据整理
import pandas as pd
cnboo=pd.read_excel("cnboNPPD1.xlsx")
cnboo

# 设定调色盘
sns.set_palette(color)
sns.palplot(sns.color_palette(color,11)) # 表示11种颜色

sns.set_palette(color)
sns.palplot(sns.color_palette(color,11))
plt.figure(figsize=(25,20))
plt.title('电影票房')
plt.xticks(rotation=45)
sns.barplot(x='TYPE',
            y='PRICE',
            hue='TYPE',
            data=cnboo)

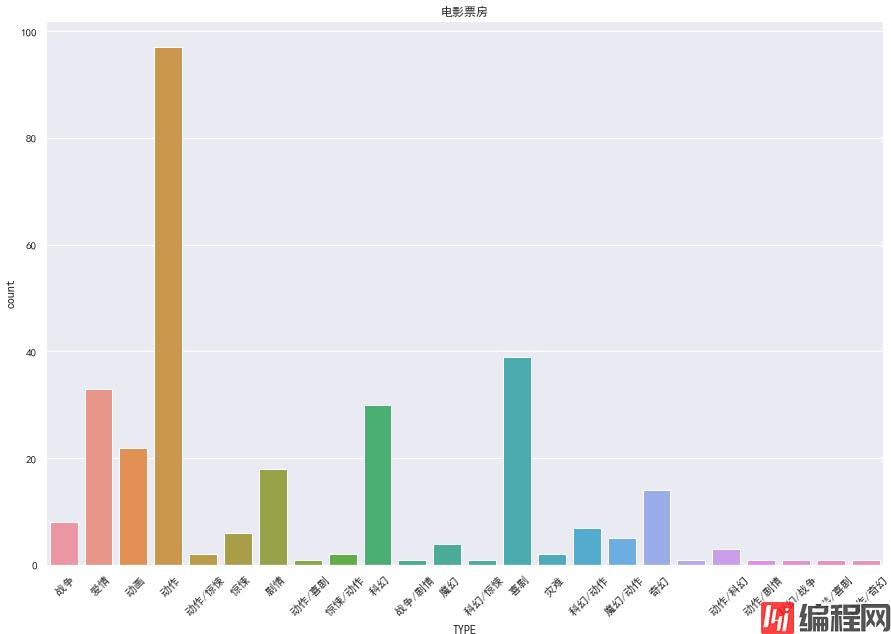
sns.set_palette(color)
sns.palplot(sns.color_palette(color,11))
plt.figure(figsize=(15,10))
plt.title('电影票房')
plt.xticks(rotation=45)
sns.countplot(x='TYPE',data=cnboo)
sns.set_palette(color)
sns.palplot(sns.color_palette(color,11))
plt.figure(figsize=(15,10))
plt.title('电影票房')
plt.xticks(rotation=45)
sns.pointplot(x='TYPE',y='PRICE',data=cnboo)
plt.show()

sns.set_palette(color)
sns.palplot(sns.color_palette(color,11))
plt.figure(figsize=(25,10))
plt.title('电影票房')
plt.xticks(rotation=45)
sns.pointplot(x='TYPE',y='PRICE',hue='REGION',data=cnboo)
plt.show()

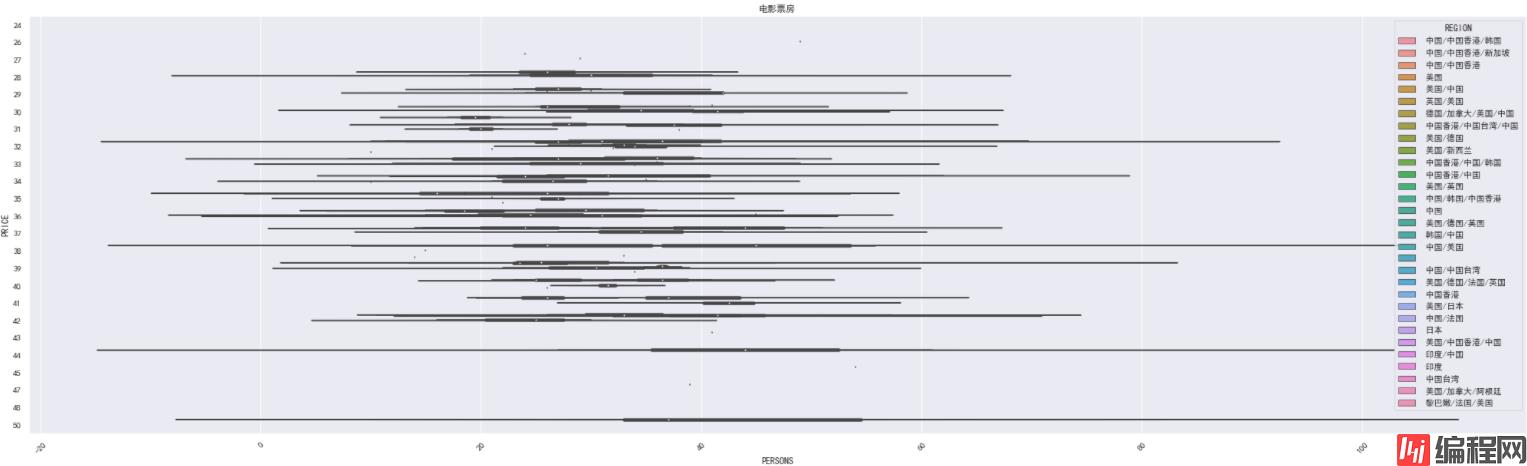
### 05 箱型图
sns.set_palette(color)
sns.palplot(sns.color_palette(color,11))
plt.figure(figsize=(35,10))
plt.title('电影票房')
plt.xticks(rotation=45)
sns.boxplot(x='TYPE',y='PERSONS',hue='REGION',data=cnboo) # ,markers=['^','o'],linestyles=['-','--']
plt.show()
# 图中的单个点代表在此数据当中的异常值

### 06 小提琴图
sns.set_palette(color)
sns.palplot(sns.color_palette(color,11))
plt.figure(figsize=(35,10))
plt.title('电影票房')
plt.xticks(rotation=45)
sns.violinplot(x='TYPE',y='PRICE',hue='REGION',data=cnboo) # ,markers=['^','o'],linestyles=['-','--']
plt.show()

绘制横着的小提琴图:
sns.set_palette(color)
sns.palplot(sns.color_palette(color,11))
plt.figure(figsize=(35,10))
plt.title('电影票房')
plt.xticks(rotation=45)
sns.violinplot(x='PERSONS',y='PRICE',hue='REGION',data=cnboo,orient='h')
plt.show()
到此这篇关于python matplotlib seaborn绘图教程详解的文章就介绍到这了,更多相关Python seaborn绘图内容请搜索编程网以前的文章或继续浏览下面的相关文章希望大家以后多多支持编程网!
--结束END--
本文标题: Python matplotlib seaborn绘图教程详解
本文链接: https://www.lsjlt.com/news/142356.html(转载时请注明来源链接)
有问题或投稿请发送至: 邮箱/279061341@qq.com QQ/279061341
下载Word文档到电脑,方便收藏和打印~
2024-03-01
2024-03-01
2024-03-01
2024-02-29
2024-02-29
2024-02-29
2024-02-29
2024-02-29
2024-02-29
2024-02-29
回答
回答
回答
回答
回答
回答
回答
回答
回答
回答


官方手机版

微信公众号

商务合作


0