在Vue中, 查找到有两种方法来实现词云图, 分别是echarts 和 highcharts Echarts: 注意,Wordcloud对应的echarts版本有要求:echarts
在Vue中, 查找到有两种方法来实现词云图, 分别是echarts 和 highcharts
注意,Wordcloud对应的echarts版本有要求:echarts-wordcloud@2 is for echarts@5 echarts-wordcloud@1 is for echarts@4需要下载echartsjs 和 wordcloud, 全局注册引用echarts
	npm install echarts@5
	npm install echarts-wordcloud@2
<div class="cloud-wrap">
    <div ref="cloudEl" class="cloud-box"></div>
</div>
<style>
.cloud-wrap {
    width: 100%;
    height: 100%;
}
 .cloud-box {
     width: 100%;
     height: 100%;
 }
</style>
<script>
import wordcloud from 'echarts-wordcloud';
export default {
	data() {
		return {
			words:[{
				id:1,
				content:'name'
			}],
			bgImg:'base64格式, 底色为白色',
		}
	},
	mounted() {
      this.drawCloud(this.$refs.cloudEl, this.words);
  	},
  	methods:{
	  	drawCloud(wrapEl, data) {
	        // let maskImage = new Image(); //可以根据图片形状生成有形状的词云图
	        // maskImage.src= this.bgImg;
	        let list = this.wordCloudData.map((item) => ({
	            name: item.content,
	            value: item.id
	        }))
	        if(list.length == 0){
	            list = [{name:'无',value:50}]
	        }
	        let myChart = echarts.init(wrapEl);
	        let option =
	        {
	            tooltip: {
	                show: true,
	            },
	            // backgroundColor:'#fff', // 画布背景色
	            series: [
	            {
	                name: "热词",
	                type: "wordCloud",
	                // maskImage: maskImage, // 图片形状
	                keepAspect: false,
	                sizeRange: [10, 40], //画布范围,如果设置太大会出现少词(溢出屏幕)
	                rotationRange: [0, 0], //数据翻转范围
	                // shape: "circle",
	                // drawOutOfBound: true, // 超出画布的词汇是否隐藏
	                drawOutOfBound: false,
	                color:"#fff",
	                left: "center",
	                top: "center",
	                right: null,
	                bottom: null,
	                // width: "100%",
	                height: "100%",
	                gridSize: 8,
	                textPadding: 10,
	                autoSize: {
	                    enable: true,
	                    minSize: 6,
	                },
	                textStyle: {
	                    nORMal: {
	                        fontFamily: 'sans-serif',
	                        fontWeight: 'bold',
	                        color:"#333", // 字体颜色
	                        // color: function () { // 字体颜色
	                        //     return 'rgb(' + [
	                        //         Math.round(Math.random() * 160),
	                        //         Math.round(Math.random() * 160),
	                        //         Math.round(Math.random() * 160)
	                        //     ].join(',') + ')';
	                        // },
	                    },
	                    emphasis: {
	                        // focus: 'self',
	                        textStyle:{
	                            shadowBlur: 10,
	                            shadowColor: "#333",
	                        }
	                    },
	                },
	                data: list,
	            },
	            ],
	        };
	        // maskImage.onload = function() {
	            myChart.setOption(option, true)
	        // };
	    },
  	}
}
</script>

无遮罩层的词云图↑
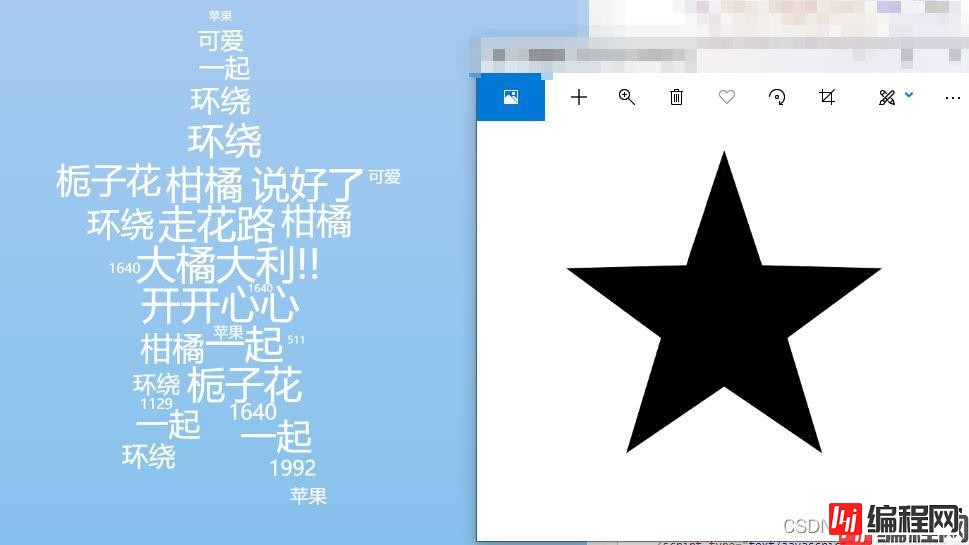
有遮罩层的词云图↑
下载包
npm install highcharts@7.2.1
<div class="cloud-wrap">
    <div id="container" style="width: 100%;height: 100%;"></div>
</div>
<style>
	// 同上
</style>
<script>
import Highcharts from 'highcharts'
export default {
	data() {
		return {
			words:[{
				id:1,
				content:'name'
			}],
		}
	},
	mounted() {
      this.dealData();
  	},
  	methods:{
	    dealData(){
	        let data = this.words.map((item,index) => ({
	            name: item.content,
	            value: item.id,
	            //weight: Math.floor(Math.random()*3+1)
	            //控制加粗,随机数取1~3, 若需要按照接口返回的顺序, 可不随机
	            weight: item.id*100
	        }))
	        this.drawPic(data)
	    },
	    drawPic(data){
	        Highcharts.chart('container', {
	            //highcharts loGo
	            credits: { enabled: false },
	            //导出
	            exporting: { enabled: false },
	            //提示关闭
	            tooltip: { enabled: false },
	            //颜色配置
	            colors:[
	                '#ffffff'
	                // ,'#00c0d7','#2594ce','#de4c85',
	                // '#ff7f46','#ffb310','#e25c52'
	            ],
	            //图形配置
	            chart: {
	                // spacingBottom: 15,
	                // spacingTop: 12,
	                spacingLeft: 5,
	                spacingRight: 5,
	                backgroundColor: "rgba(255, 255, 255,0)",
	            },

	            series: [{
	                type: "wordcloud",// 类型
	                data: data,
	                rotation: 90,//字体不旋转
	                maxFontSize: 40,//最大字体
	                minFontSize: 14,//最小字体
	                style: {
	                    fontFamily: "sans-serif",
	                    fontWeight: '500'
	                }
	            }],
	        });
	    },
  	}
}
</script>
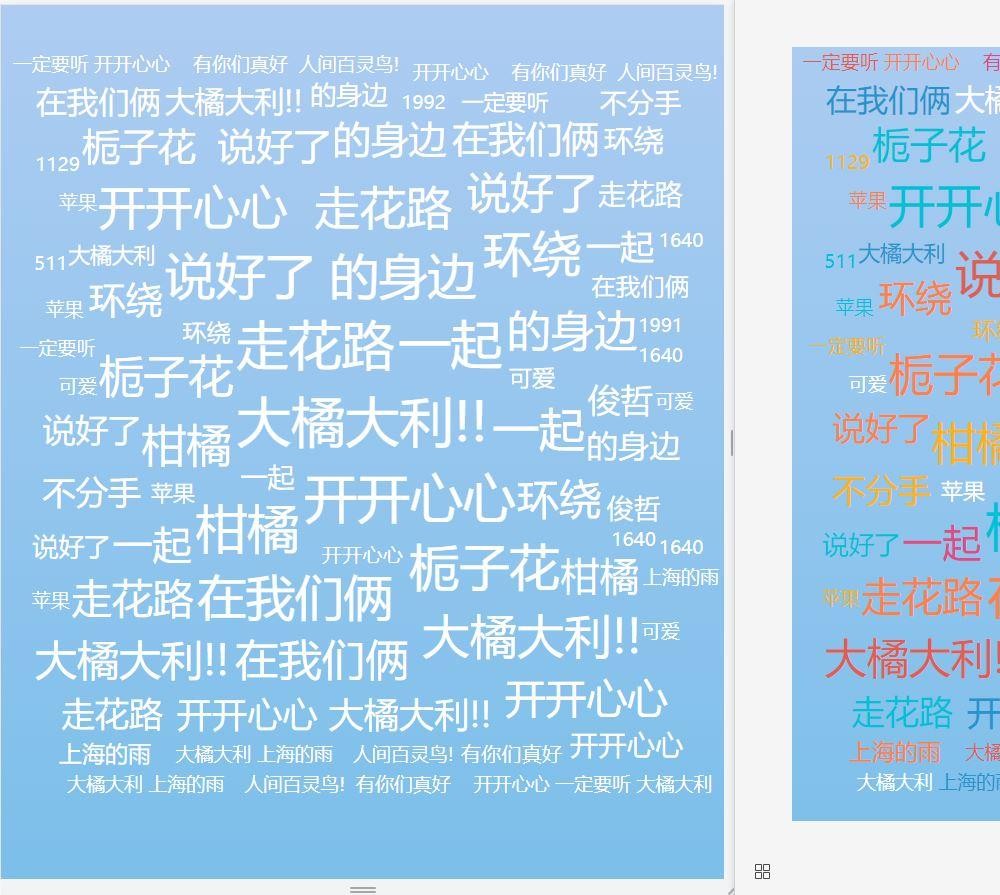
echarts 和 highcharts 都可以在vue中实现词云图. 但是如果使用echarts的话, 需要当前的echarts进行升级或降级才能实现字体多颜色, 而highcharts则不需要. 自定义形状highcharts暂时还没探究, 需要的可以自行查找, 以后有机会的话我也会看看.
到此这篇关于vue中使用词云图的文章就介绍到这了,更多相关vue中使用词云图内容请搜索编程网以前的文章或继续浏览下面的相关文章希望大家以后多多支持编程网!
--结束END--
本文标题: vue中使用词云图的实现示例
本文链接: https://www.lsjlt.com/news/164063.html(转载时请注明来源链接)
有问题或投稿请发送至: 邮箱/279061341@qq.com QQ/279061341
下载Word文档到电脑,方便收藏和打印~
2024-01-12
2023-05-20
2023-05-20
2023-05-20
2023-05-20
2023-05-20
2023-05-20
2023-05-20
2023-05-20
2023-05-20
回答
回答
回答
回答
回答
回答
回答
回答
回答
回答


官方手机版

微信公众号

商务合作


0