Python 官方文档:入门教程 => 点击学习
正常状态是UP,跳闸是⼀种状态CIRCUIT_OPEN,可以通过/health查看,前提是工程中需要引入SpringBoot的actuator(健康监控),它提供了很多监控所需的接口
正常状态是UP,跳闸是⼀种状态CIRCUIT_OPEN,可以通过/health查看,前提是工程中需要引入SpringBoot的actuator(健康监控),它提供了很多监控所需的接口,可以对应用系统进行配置查看、相关功能统计等。
已经统一添加在父工程中
<dependency>
<groupId>org.springframework.boot</groupId>
<artifactId>spring-boot-starter-actuator</artifactId>
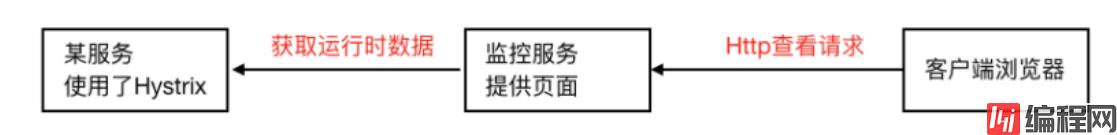
</dependency>如果我们想看到Hystrix相关数据,比如有多少请求、多少成功、多少失败、多少降级等,那么引入SpringBoot健康监控之后,访问/actuator/hystrix.stream接口可以获取到监控的文字信息,但是不直观,所以Hystrix官方还提供了基于图形化的DashBoard(仪表板)监控平 台。Hystrix仪表板可以显示每个断路器(被@HystrixCommand注解的方法)的状态。

1)新建一个监控服务工程,导入依赖
<?xml version="1.0" encoding="UTF-8"?>
<project xmlns="Http://Maven.apache.org/POM/4.0.0"
         xmlns:xsi="http://www.w3.org/2001/XMLSchema-instance"
         xsi:schemaLocation="http://maven.apache.org/POM/4.0.0 http://maven.apache.org/xsd/maven-4.0.0.xsd">
    <parent>
        <artifactId>laGou-parent</artifactId>
        <groupId>com.lagou</groupId>
        <version>1.0-SNAPSHOT</version>
    </parent>
    <modelVersion>4.0.0</modelVersion>
    <artifactId>lagou-cloud-hystrix-dashboard-9000</artifactId>
    <dependencies><!--hystrix-->
        <dependency>
            <groupId>org.springframework.cloud</groupId>
            <artifactId>spring-cloud-starter-netflix-hystrix</artifactId>
        </dependency>
        <!--hystrix 仪表盘-->
        <dependency>
            <groupId>org.springframework.cloud</groupId>
            <artifactId>spring-cloud-starter-netflix-hystrix-dashboard</artifactId>
        </dependency>
        <dependency>
            <groupId>org.springframework.cloud</groupId>
            <artifactId>spring-cloud-starter-netflix-eureka-client</artifactId>
        </dependency>
    </dependencies>
    <properties>
        <maven.compiler.source>11</maven.compiler.source>
        <maven.compiler.target>11</maven.compiler.target>
    </properties>
</project>
2)启动类添加@EnableHystrixDashboard激活仪表盘
package com.lagou.edu;
import org.springframework.boot.SpringApplication;
import org.springframework.boot.autoconfigure.SpringBootApplication;
import org.springframework.cloud.netflix.hystrix.dashboard.EnableHystrixDashboard;
@SpringBootApplication
@EnableHystrixDashboard // 开启hystrix dashboard
public class HystrixDashboardApplication9000 {
    public static void main(String[] args) {
        SpringApplication.run(HystrixDashboardApplication9000.class, args);
    }
}
3) application.yml
server:
port: 9000
Spring:
application:
name: lagou-cloud-hystrix-dashboard
eureka:
client:
serviceUrl: # eureka server的路径
defaultZone: http://LagouCloudEurekaServerB:8762/eureka,http://LagouCloudEurekaServerA:8761/eureka #把 eureka 集群中的所有 url 都填写了进来,也可以只写⼀台,因为各个 eureka server 可以同步注册表
instance:
#使⽤ip注册,否则会使⽤主机名注册了(此处考虑到对⽼版本的兼容,新版本经过实验都是ip)
prefer-ip-address: true
#⾃定义实例显示格式,加上版本号,便于多版本管理,注意是ip-address,早期版本是ipAddress
instance-id: ${spring.cloud.client.ipaddress}:${spring.application.name}:${server.port}:@project.version@
4)在被监测的微服务中注册监控servlet(自动投递微服务,监控数据就是来自于这个微服务)
package com.lagou.edu;
import com.netflix.hystrix.contrib.metrics.eventstream.HystrixMetriCSStreamServlet;
import org.springframework.boot.SpringApplication;
import org.springframework.boot.autoconfigure.SpringBootApplication;
import org.springframework.boot.WEB.servlet.ServletReGIStrationBean;
import org.springframework.cloud.client.SpringCloudApplication;
import org.springframework.cloud.client.circuitbreaker.EnableCircuitBreaker;
import org.springframework.cloud.client.discovery.EnableDiscoveryClient;
import org.springframework.cloud.client.loadbalancer.LoadBalanced;
import org.springframework.cloud.netflix.hystrix.EnableHystrix;
import org.springframework.context.annotation.Bean;
import org.springframework.web.client.RestTemplate;
@SpringBootApplication
@EnableDiscoveryClient
// @EnableHystrix // 打开Hystrix功能
@EnableCircuitBreaker // 开启熔断器功能(这个与@EnableHystrix的功能相同,只不过它是通用注解)
// @SprinGCloudApplication // 综合性注解 @SpringCloudApplication = @SpringBootApplication + @EnableDiscoveryClient + @EnableCircuitBreaker
public class AutoDeliverApplication {
    public static void main(String[] args) {
        SpringApplication.run(AutoDeliverApplication.class, args);
    }
    // 使用RestTemplate模板对象远程调用
    @Bean
    @LoadBalanced
    public RestTemplate gerRestTemplate() {
        return new RestTemplate();
    }

    @Bean
    public ServletRegistrationBean getServlet() {
        HystrixMetricsStreamServlet streamServlet = new HystrixMetricsStreamServlet();
        ServletRegistrationBean registrationBean = new ServletRegistrationBean(streamServlet);
        registrationBean.setLoadOnStartup(1);
        registrationBean.addUrlMappings("/actuator/hystrix.stream");
        registrationBean.setName("HystrixMetricsStreamServlet");
        return registrationBean;
    }
}
被监控微服务发布之后,可以直接访问监控servlet,但是得到的数据并不直观,后期可以结合仪表盘更友好的展示

5)访问测试http://localhost:9000/hystrix

输入监控的微服务端点地址,展示监控的详细数据,比如监控服务消费者http://localhost:8090/actuator/hystrix.stream

实心圆:
大小:代表请求流量的大小,流量越大球越大颜色:代表请求处理的健康状态,从绿色到红色递减,绿色代表健康,红色就代表很不健康
曲线波动图:记录了2分钟内该方法上流量的变化波动图,判断流量上升或者下降的趋势
到此这篇关于Hystrix Dashboard断路监控仪表盘的实现详细介绍的文章就介绍到这了,更多相关Hystrix Dashboard断路监控内容请搜索编程网以前的文章或继续浏览下面的相关文章希望大家以后多多支持编程网!
--结束END--
本文标题: Hystrix Dashboard断路监控仪表盘的实现详细介绍
本文链接: https://www.lsjlt.com/news/166570.html(转载时请注明来源链接)
有问题或投稿请发送至: 邮箱/279061341@qq.com QQ/279061341
下载Word文档到电脑,方便收藏和打印~
2024-03-01
2024-03-01
2024-03-01
2024-02-29
2024-02-29
2024-02-29
2024-02-29
2024-02-29
2024-02-29
2024-02-29
回答
回答
回答
回答
回答
回答
回答
回答
回答
回答


官方手机版

微信公众号

商务合作


0