当会话从磁盘直接读取数据块到PGA(绕过SGA)时,发生direct path read/read temp等待事件 ,下图简要描述了这种方式的读取方式
当会话从磁盘直接读取数据块到PGA(绕过SGA)时,发生direct path read/read temp等待事件 ,下图简要描述了这种方式的读取方式:
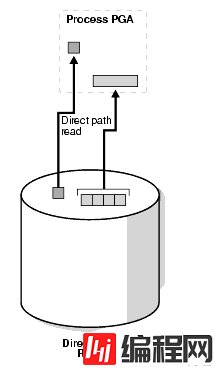
如果I/O子系统不支持异步I/Os,那么每个等待对应于一个物理读请求。
direct path read/direct path read temp等待事件有三个参数,位于User I/O等待类下面
sql> select name,parameter1,parameter2,parameter3,wait_class from v$event_name where name like 'direct path %';
NAME PARAMETER1 PARAMETER2 PARAMETER3 WAIT_CLASS
------------------------------ -------------------- -------------------- -------------------- --------------------
direct path sync File number Flags User I/O
direct path read file number first dba block cnt User I/O
direct path read temp file number first dba block cnt User I/O
direct path write file number first dba block cnt User I/O
direct path write temp file number first dba block cnt User I/O
file#:要读取的数据块所在数据文件的文件号
first dba:要读取的起始数据块号
block cnt:要读取的数据块数目
导致此等待事件的原因有四个:
1.执行的sql语句含有大量排序数据 order by/group by/union/distinct/rollup等
当PGA中排序区不足时,oracle会将排序结果写入到临时表空间中(direct path write temp)。当从临时表空间中读取排序数据时会在direct path read temp事件上等待。
2.hash join
hash在构建hash table时,将不适合位于内存中的hash partition刷出到临时表空间,随后hash partition被读回到内存时会发生direct path read temp等待事件。
3.并行查询
并行执行过程中,direct path read等待事件只与Master会话派生出的Slave会话有关,Slave会话会在direct path read事件上等待,而Master会话等待的是PX Deq。
4.全表扫描
11g后如果Oracle感觉表足够大,则会进行直接路径读取。
下面依次进行测试
session1:
SQL> alter session set workarea_size_policy=manual; --设为手动pga管理
Session altered.
SQL> alter session set sort_area_size=65536;--设置排序允许的内存大小
Session altered.
SQL> create table scott.tb_test as select * from dba_objects where rownum < 1000; --创建测试表
Table created.
session2:
SQL> oradebug setospid 7038 --设置10046事件追踪session1
Oracle pid: 20, Unix process pid: 7038, image: oracle@node3 (TNS V1-V3)
SQL> oradebug event 10046 trace name context forever,level 12;
Statement processed.
SQL> oradebug tracefile_name
/opt/app/oracle/diag/rdbms/bddev1/BDDEV1/trace/BDDEV1_ora_7038.trc
排序前session1对临时表空间直接读写的统计如下:
SQL> select a.name,b."VALUE"
2 from v$statname a,v$sesstat b
3 where b.sid = 18
4 and a."STATISTIC#" = b."STATISTIC#"
5 and a."NAME" like '%direct temp%';
NAME VALUE
---------------------------------------------------------------- ----------
physical reads direct temporary tablespace 0
physical writes direct temporary tablespace 0
session1:
SQL> select object_id from (select rownum rn,a.* from scott.tb_test a order by 1,2,3 desc) a where rn = 2;
OBJECT_ID
----------
46
此时查看追踪文件:
select object_id from (select rownum rn,a.* from scott.tb_test a order by 1,2,3 desc) a where rn = 2
END OF STMT
PARSE #139877337074560:c=10940,e=16752,p=13,cr=64,cu=0,mis=1,r=0,dep=0,og=1,plh=240700742,tim=1542267932869427
EXEC #139877337074560:c=32,e=32,p=0,cr=0,cu=0,mis=0,r=0,dep=0,og=1,plh=240700742,tim=1542267932869711
WAIT #139877337074560: nam='SQL*Net message to client' ela= 4 driver id=1650815232 #bytes=1 p3=0 obj#=88859 tim=1542267932869799
WAIT #139877337074560: nam='Disk file operations I/O' ela= 39 FileOperation=2 fileno=201 filetype=2 obj#=88859 tim=1542267932870591
WAIT #139877337074560: nam=' direct path write temp ' ela= 5112 file number=201 first dba=6528 block cnt=1 obj#=88859 tim=1542267932875922
WAIT #139877337074560: nam=' direct path write temp ' ela= 7399 file number=201 first dba=6529 block cnt=1 obj#=88859 tim=1542267932883416
WAIT #139877337074560: nam= 'direct path write temp' ela= 237 file number=201 first dba=6530 block cnt=1 obj#=88859 tim=1542267932883751
WAIT #139877337074560: nam=' direct path write temp' ela= 242 file number=201 first dba=6531 block cnt=1 obj#=88859 tim=1542267932884205
WAIT #139877337074560: nam=' direct path write temp' ela= 246 file number=201 first dba=6532 block cnt=1 obj#=88859 tim=1542267932884637
WAIT #139877337074560: nam= 'direct path read temp' ela= 21 file number=201 first dba=6528 block cnt=4 obj#=88859 tim=1542267932884757
FETCH #139877337074560:c=1865,e=14945,p=4,cr=16,cu=2,mis=0,r=1,dep=0,og=1,plh=240700742,tim=1542267932884816
WAIT #139877337074560: nam='SQL*Net message from client' ela= 197 driver id=1650815232 #bytes=1 p3=0 obj#=88859 tim=1542267932885067
WAIT #139877337074560: nam=' direct path read temp' ela= 16 file number=201 first dba=6532 block cnt=1 obj#=88859 tim=1542267932885400
FETCH #139877337074560:c=516,e=515,p=1,cr=0,cu=0,mis=0,r=0,dep=0,og=1,plh=240700742,tim=1542267932885620
STAT #139877337074560 id=1 cnt=1 pid=0 pos=1 obj=0 op='VIEW (cr=16 pr=5 pw=5 time=14948 us cost=73 size=25974 card=999)'
STAT #139877337074560 id=2 cnt=999 pid=1 pos=1 obj=0 op='SORT ORDER BY (cr=16 pr=5 pw=5 time=16680 us cost=73 size=206793 card=999)'
STAT #139877337074560 id=3 cnt=999 pid=2 pos=1 obj=0 op='COUNT (cr=16 pr=0 pw=0 time=4019 us)'
STAT #139877337074560 id=4 cnt=999 pid=3 pos=1 obj=88861 op='TABLE ACCESS FULL TB_TEST (cr=16 pr=0 pw=0 time=1268 us cost=6 size=206793 card=999)'
WAIT #139877337074560: nam='SQL*Net message to client' ela= 2 driver id=1650815232 #bytes=1 p3=0 obj#=88859 tim=1542267932885761
此时再查看session1对临时表空间直接读写的统计:
NAME VALUE
---------------------------------------------------------------- ----------
physical reads direct temporary tablespace 5
physical writes direct temporary tablespace 5
可看到,由于排序操作, Oracle对临时表空间执行了5次直接写,每次写1个block;执行了2次直接读,分别读取了4个block和1个block。
也可以在sql执行过程中,查看直接读写发生的表空间和段类型:
SQL> select a.event,a.sid, c.sql_hash_value hash_value,decode(d.ktssosegt,1,'SORT', 2,'HASH',3,'DATA',4,'INDEX',5,'LOB_DATA',6,'LOB_INDEX',null) as segment_type,b.tablespace_name,b.file_name
2 from v$session_wait a, dba_data_files b, v$session c, x$ktsso d
3 where c.saddr = d.ktssoses(+)
4 and c.serial#= d.ktssosno(+)
5 and d.inst_id(+) = userenv('instance')
6 and a.sid = c.sid
7 and a.p1 = b.file_id
8 and a.event like 'direct path %'
9 uNIOn all
10 select a.event,a.sid,d.sql_hash_value hash_value,decode(e.ktssosegt,1,'SORT', 2,'HASH',3,'DATA',4,'INDEX',5,'LOB_DATA',6,'LOB_INDEX',null) as segment_type,b.tablespace_name,b.file_name
11 from v$session_wait a, dba_temp_files b, v$parameter c, v$session d, x$ktsso e
12 where d.saddr = e.ktssoses(+)
13 and d.serial#= e.ktssosno(+)
14 and e.inst_id(+) = userenv('instance')
15 and a.sid = d.sid
16 and b.file_id= a.p1 - c.value
17 and c.name= 'db_files'
18 and a.event like 'direct path %'
19 order by 1,2;
EVENT SID HASH_VALUE SEGMENT_T TABLESPACE_NAME FILE_NAME
------------------------------ ---------- ---------- --------- -------------------- --------------------------------------------------
direct path write temp 133 474626757 HASH TEMP /opt/app/oracle/oradata/BDDEV1/temp01.dbf
SQL> /
EVENT SID HASH_VALUE SEGMENT_T TABLESPACE_NAME FILE_NAME
------------------------------ ---------- ---------- --------- -------------------- --------------------------------------------------
direct path read temp 133 474626757 HASH TEMP /opt/app/oracle/oradata/BDDEV1/temp01.dbf
可看到占用临时表空间的确实是hash对象
创建测试表2:
SQL> create table scott.tb_test2 as select * from dba_objects where rownum < 2;
Table created.
hash join前session1对临时表空间直接读写的统计如下:
NAME VALUE
---------------------------------------------------------------- ----------
physical reads direct temporary tablespace 225
physical writes direct temporary tablespace 718
session1执行查询:
SQL> select a.object_id
2 from scott.tb_test a,scott.tb_test2 b
3 where a.object_name = b.object_name;
OBJECT_ID
----------
20
查看追踪文件:
PARSING IN CURSOR #139877337073608 len=125 dep=0 uid=0 oct=3 lid=0 tim=1542269239154410 hv=3044439960 ad='a54bb978' sqlid='djdqhmuurcxws'
select a.object_id
from scott.tb_test a,scott.tb_test2 b
where a.object_name = b.object_name
END OF STMT
PARSE #139877337073608:c=83,e=83,p=0,cr=0,cu=0,mis=0,r=0,dep=0,og=1,plh=3759002927,tim=1542269239154407
EXEC #139877337073608:c=53,e=54,p=0,cr=0,cu=0,mis=0,r=0,dep=0,og=1,plh=3759002927,tim=1542269239154772
WAIT #139877337073608: nam='SQL*Net message to client' ela= 3 driver id=1650815232 #bytes=1 p3=0 obj#=88864 tim=1542269239154834
WAIT #139877337073608: nam=' direct path write temp' ela= 6823 file number=201 first dba=6528 block cnt=1 obj#=88864 tim=1542269239162866
WAIT #139877337073608: nam= 'direct path write temp' ela= 7342 file number=201 first dba=6529 block cnt=1 obj#=88864 tim=1542269239170355
WAIT #139877337073608: nam=' direct path write temp' ela= 249 file number=201 first dba=6530 block cnt=1 obj#=88864 tim=1542269239170970
WAIT #139877337073608: nam= 'direct path write temp' ela= 271 file number=201 first dba=6531 block cnt=1 obj#=88864 tim=1542269239171450
WAIT #139877337073608: nam=' direct path read temp' ela= 19 file number=201 first dba=6531 block cnt=1 obj#=88864 tim=1542269239171572
WAIT #139877337073608: nam= 'direct path read temp' ela= 14 file number=201 first dba=6528 block cnt=1 obj#=88864 tim=1542269239171641
WAIT #139877337073608: nam= 'direct path read temp' ela= 13 file number=201 first dba=6529 block cnt=1 obj#=88864 tim=1542269239171688
FETCH #139877337073608:c=2374,e=16849,p=3,cr=45,cu=0,mis=0,r=1,dep=0,og=1,plh=3759002927,tim=1542269239171729
WAIT #139877337073608: nam='SQL*Net message from client' ela= 170 driver id=1650815232 #bytes=1 p3=0 obj#=88864 tim=1542269239172124
WAIT #139877337073608: nam=' direct path read temp' ela= 15 file number=201 first dba=6530 block cnt=1 obj#=88864 tim=1542269239172206
FETCH #139877337073608:c=140,e=139,p=1,cr=0,cu=0,mis=0,r=0,dep=0,og=1,plh=3759002927,tim=1542269239172308
STAT #139877337073608 id=1 cnt=1 pid=0 pos=1 obj=0 op='HASH JOIN (cr=45 pr=4 pw=4 time=16850 us cost=55 size=145 card=1)'
STAT #139877337073608 id=2 cnt=2999 pid=1 pos=1 obj=88866 op='TABLE ACCESS FULL TB_TEST (cr=42 pr=0 pw=0 time=4799 us cost=14 size=236921 card=2999)'
STAT #139877337073608 id=3 cnt=1 pid=1 pos=2 obj=88862 op='TABLE ACCESS FULL TB_TEST2 (cr=3 pr=0 pw=0 time=29 us cost=3 size=66 card=1)'
WAIT #139877337073608: nam='SQL*Net message to client' ela= 2 driver id=1650815232 #bytes=1 p3=0 obj#=88864 tim=1542269239172458
此时session1对临时表空间直接读写的统计如下:
NAME VALUE
---------------------------------------------------------------- ----------
physical reads direct temporary tablespace 229
physical writes direct temporary tablespace 722
可看到, 由于排序操作,Oracle对临时表空间执行了4次直接读和4次直接写 。
为了效果明显,增加scott.tb_test表的记录数:
SQL> insert into scott.tb_test select * from scott.tb_test;
...
修改scott.tb_test表的并行度:
SQL> alter table scott.tb_test parallel 3;
session1执行查询:
SQL> select count(1) from scott.tb_test;
查询Master/Slave会话:
SQL> select decode(a.qcserial#, null, 'PARENT', 'CHILD') stmt_level,a.sid,a.serial#,b.username,b.osuser,b.sql_hash_value,b.sql_address,a.degree,a.req_degree
2 from v$px_session a, v$session b
3 where a.sid = b.sid
4 order by a.qcsid, stmt_level desc;
STMT_L SID SERIAL# USERNAME OSUSER SQL_HASH_VALUE SQL_ADDRESS DEGREE REQ_DEGREE
------ ---------- ---------- ------------------------------ ------------------------------ -------------- ---------------- ---------- ----------
PARENT 18 27857 SYS oracle 305472416 0000000069D6DD30
CHILD 20 12579 SYS oracle 305472416 0000000069D6DD30 3 3
CHILD 141 14701 SYS oracle 305472416 0000000069D6DD30 3 3
CHILD 149 21869 SYS oracle 305472416 0000000069D6DD30 3 3
可看到总共有四个session,一个parent派生出了三个child。
此时查看追踪文件,可看到parent session在进行PX Deq相关等待
select count(1) from scott.tb_test
END OF STMT
PARSE #139877336651544:c=19135,e=59969,p=8,cr=128,cu=0,mis=1,r=0,dep=0,og=1,plh=291292600,tim=1542272658766051
WAIT #139877336651544: nam='os thread startup' ela= 16334 p1=0 p2=0 p3=0 obj#=88866 tim=1542272658783336
WAIT #139877336651544: nam='os thread startup' ela= 15250 p1=0 p2=0 p3=0 obj#=88866 tim=1542272658798803
WAIT #139877336651544: nam='os thread startup' ela= 15279 p1=0 p2=0 p3=0 obj#=88866 tim=1542272658814265
WAIT #139877336651544: nam='PX Deq: Join ACK' ela= 3495 sleeptime/senderid=268500992 passes=3 p3=2778333136 obj#=88866 tim=1542272658817981
WAIT #139877336651544: nam='PX Deq: Join ACK' ela= 2 sleeptime/senderid=0 passes=0 p3=0 obj#=88866 tim=1542272658818053
WAIT #139877336651544: nam='PX Deq: Join ACK' ela= 2 sleeptime/senderid=0 passes=0 p3=0 obj#=88866 tim=1542272658818074
WAIT #139877336651544: nam='PX Deq: Parse Reply' ela= 4166 sleeptime/senderid=200 passes=1 p3=0 obj#=88866 tim=1542272658822383
WAIT #139877336651544: nam='PX Deq: Parse Reply' ela= 155 sleeptime/senderid=200 passes=1 p3=0 obj#=88866 tim=1542272658822593
WAIT #139877336651544: nam='PX Deq: Parse Reply' ela= 3778 sleeptime/senderid=200 passes=1 p3=0 obj#=88866 tim=1542272658826408
EXEC #139877336651544:c=1759,e=60216,p=0,cr=43,cu=0,mis=0,r=0,dep=0,og=1,plh=291292600,tim=1542272658826648
WAIT #139877336651544: nam='SQL*Net message to client' ela= 3 driver id=1650815232 #bytes=1 p3=0 obj#=88866 tim=1542272658826714
WAIT #139877336651544: nam='PX Deq: Execute Reply' ela= 5524 sleeptime/senderid=200 passes=1 p3=0 obj#=88866 tim=1542272658832302
WAIT #139877336651544: nam='PX Deq: Execute Reply' ela= 3 sleeptime/senderid=0 passes=0 p3=0 obj#=88866 tim=1542272658832414
WAIT #139877336651544: nam='PX Deq: Execute Reply' ela= 4277 sleeptime/senderid=200 passes=2 p3=0 obj#=88866 tim=1542272658836731
查看v$active_session_history,可看到派生出的child session在direct path read事件上等待:
SQL> select to_char(sample_time,'yyyymmdd hh34:mi:ss') stime,session_id,session_serial#,sql_id,session_state,event,p1,p2,p3,blocking_session
2 from v$active_session_history
3 where sample_time >= sysdate-1/24/60
4 order by 1 desc;
STIME SESSION_ID SESSION_SERIAL# SQL_ID SESSION EVENT P1 P2 P3 BLOCKING_SESSION
----------------- ---------- --------------- ------------- ------- ------------------------------ ---------- ---------- ---------- ----------------
20181115 18:23:49 20 12581 3hhzygn93a8x0 WAITING direct path read 4 116736 128
20181115 18:23:49 141 14711 3hhzygn93a8x0 WAITING direct path read 4 264192 128
20181115 18:23:49 149 21927 3hhzygn93a8x0 WAITING direct path read 4 275328 128
20181115 18:23:48 20 12581 3hhzygn93a8x0 WAITING direct path read 4 190848 128
20181115 18:23:48 141 14711 3hhzygn93a8x0 WAITING direct path read 4 37248 128
20181115 18:23:48 149 21927 3hhzygn93a8x0 WAITING direct path read 4 205440 128
20181115 18:23:47 20 12581 3hhzygn93a8x0 WAITING direct path read 4 139776 128
20181115 18:23:47 141 14711 3hhzygn93a8x0 WAITING direct path read 4 146816 128
20181115 18:23:47 149 21927 3hhzygn93a8x0 WAITING direct path read 4 56192 128
...
由于parent session并不在direct path read上等待,因此,如果要统计parent session在direct path read上的等待,需要用如下语句:
SQL> select a.name, b.sid, b.value, round((sysdate - c.loGon_time) * 24) hours_connected
2 from v$statname a, v$sesstat b, v$session c
3 where b.sid = c.sid
4 and a.statistic# = b.statistic#
5 and b.value > 0
6 and a.name= 'physical reads direct'
7 order by b.value;
NAME SID VALUE HOURS_CONNECTED
------------------------------ ---------- ---------- ---------------
physical reads direct 18 977016 0
其中panret session的值为所有child session的累积。
从11G之后,direct path read不仅可用于并行查询,在符合某些条件后,串行的全表扫描也可以利用direct path read方式来完成。
以下总结引用“ 深入分析direct path read(11G)http://www.itpub.net/thread-1815281-1-1.html (出处: ITPUB论坛-中国专业的IT技术社区) ”的测试结果
采用direct path read完成读取的条件:
1)表大于_small_table_threshold的参数值设置。
_small_table_threshold的单位为block。默认为db cache size的2%大小,在实例启动过程中动态决定。11GR2之前,表的大小要是_small_table_threshold参数值的5倍才会采取直接路径读取方式,11GR2后只需要满足_small_table_threshold定义的大小就会采取直接路径读取。
2)表上的脏块小于表总block数的25%
3)表中的块被cache的比例小于50%的时候
自己实际测下来,1是准的,2与3不准,暂时存疑。
1._ serial_direct_read =false
2.Event: '10949 trace name context forever, level 1'
--结束END--
本文标题: direct path read/read temp等待事件
本文链接: https://www.lsjlt.com/news/45838.html(转载时请注明来源链接)
有问题或投稿请发送至: 邮箱/279061341@qq.com QQ/279061341
下载Word文档到电脑,方便收藏和打印~
2024-05-15
2024-05-15
2024-05-15
2024-05-15
2024-05-15
2024-05-15
2024-05-15
2024-05-15
2024-05-15
2024-05-15
回答
回答
回答
回答
回答
回答
回答
回答
回答
回答


官方手机版

微信公众号

商务合作


0