前言 eCharts作为国内优秀的开源图表工具,功能强大,但是使用中也存在一定的问题。 文档更新较慢,文档说明不详细。 前端使用的弱类型语言,数据结构在灵活的同时,也容易造成一些问题。例如某些属性到底应该放入怎么样的数据才是正确
![[开源][示例更新]eCharts配置简化包OptionCreator[typescript版]](/upload/202205/01/dvqse3ozhta.jpg)
eCharts作为国内优秀的开源图表工具,功能强大,但是使用中也存在一定的问题。
该项目的开发,包括一个以源码形式发布的typescript库,以及一个示例网站。
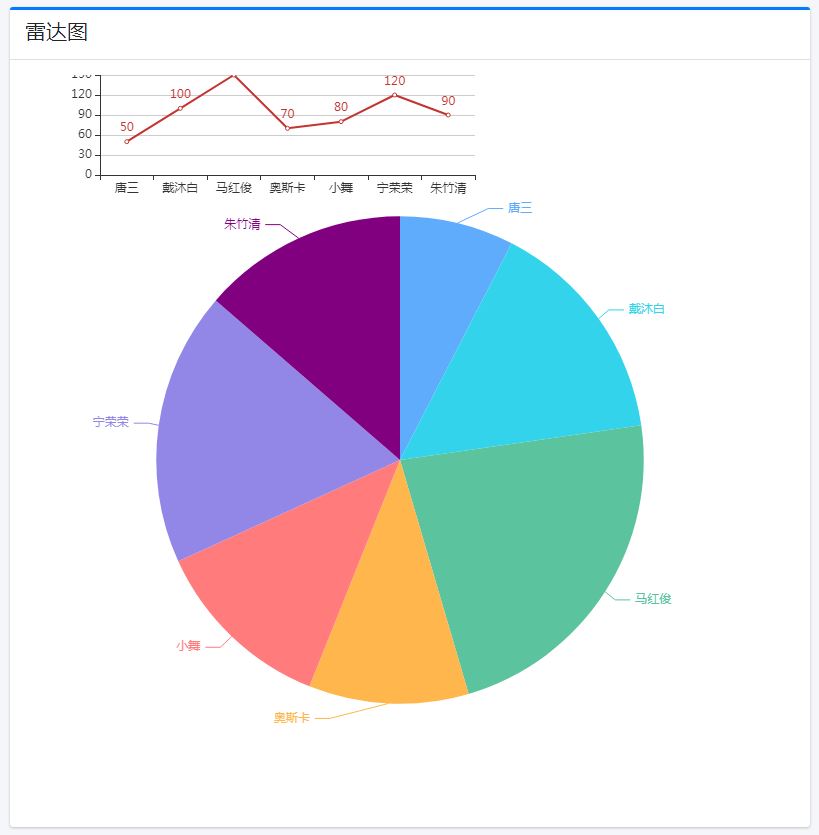
   this.Sample_Pie_Bar = PieOption.CreatePie(CommonFunction.clone(dataset), "65%");
        this.Sample_Pie_Bar.series[0].label.show = true;
        this.Sample_Pie_Bar.series[0]["color"] = ChartColor.colorlist_7_Baidu;

        let cateGory = ["唐三", "戴沐白", "马红俊", "奥斯卡", "小舞", "宁荣荣", "朱竹清"];
        let value = [50, 100, 150, 70, 80, 120, 90];
        let line = LineOption.CreateLineItem(value);
        //line用坐标轴的修正
        var line_xAsix = new Axis();
        line_xAsix.type = "category";
        line_xAsix.data = category;
        var line_yAsix = new Axis();
        line_yAsix.type = "value";
        this.Sample_Pie_Bar.xAxis = [line_xAsix];
        this.Sample_Pie_Bar.yAxis = [line_yAsix];
        this.Sample_Pie_Bar.grid = [{
            "top": "0%", "left": "10%", "width": "50%", "height": "100"
        }]
        line_xAsix.gridIndex = 0;
        line_yAsix.gridIndex = 0;
        line.xAxisIndex = 0;
        line.yAxisIndex = 0;
        //图(Chart)和坐标(Axis)绑定,坐标和网格(Grid)绑定
        this.Sample_Pie_Bar.series.push(line);
现时点完成功能如下
截图:
Demo:Http://datavisualization.club:8081/basic/bar
GitHub:https://github.com/magicdict/VisLab
--结束END--
本文标题: [开源][示例更新]eCharts配置简化包OptionCreator[typescript版]
本文链接: https://www.lsjlt.com/news/7053.html(转载时请注明来源链接)
有问题或投稿请发送至: 邮箱/279061341@qq.com QQ/279061341
下载Word文档到电脑,方便收藏和打印~
2024-05-16
2024-05-16
2024-05-16
2024-05-15
2024-05-15
2024-05-15
2024-05-15
2024-05-15
2024-05-15
2024-05-15
回答
回答
回答
回答
回答
回答
回答
回答
回答
回答


官方手机版

微信公众号

商务合作


0