Python 官方文档:入门教程 => 点击学习
目录1、memory_profiler进程监视2、timeit 时间使用情况3、line_profiler行代码运行时间检测4、heartrate可视化检测工具前言: python虽
前言:
python虽然是一门'慢语言',但是也有着比较多的性能检测工具来帮助我们优化程序的运行效率。这里总结了五个比较好的Python性能检测工具,包括内存使用、运行时间、执行次数等方面。
首先,来编写一个基础的python函数用于在后面的各种性能测试。
def base_func():
    for n in range(10000):
print('当前n的值是:{}'.fORMat(n))memory_profiler是python的非标准库,所以这里采用pip的方式进行安装。
它能够监视进程、了解内存使用等情况。
pip install memory_profiler
安装好memory_profiler库以后,直接使用注解的方式进行测试
from memory_profiler import profile
@profile
def base_func1():
    for n in range(10000):
        print('当前n的值是:{}'.format(n))
base_func1()
# Line #    Mem usage    Increment  Occurrences   Line Contents
# =============================================================
#     28     45.3 MiB     45.3 MiB           1   @profile
#     29                                         def base_func():
#     30     45.3 MiB      0.0 MiB       10001       for n in range(10000):
#     31     45.3 MiB      0.0 MiB       10000           print('当前n的值是:{}'.format(n))
从返回的数据结果来看,执行当前函数使用了45.3 MiB的内存。
timeit是python的内置模块,可以测试单元格的代码运行时间,由于是内置模块所以并不需要单独安装。
import timeit
def base_func2():
    for n in range(10000):
        print('当前n的值是:{}'.format(n))
res = timeit.timeit(base_func2,number=5)
print('当前的函数的运行时间是:{}'.format(res))
当前的函数的运行时间是:0.9675800999999993
根据上面函数的运行返回结果,函数的运行时间是0.96秒。
如果在只需要检测函数的局部运行时间的话就可以使用line_profiler了,它可以检测出每行代码的运行时间。
line_profiler是python的非标准库,使用的使用pip的方式安装一下。
pip install line_profiler最简便的使用方式直接将需要测试的函数加入即可。
def base_func3():
    for n in range(10000):
        print('当前n的值是:{}'.format(n))
from line_profiler import LineProfiler
lp = LineProfiler()
lp_wrap = lp(base_func3)
lp_wrap()

lp.print_stats()

# Line #      Hits         Time  Per Hit   % Time  Line Contents
# ==============================================================
#     72                                           def base_func3():
#     73     10001     162738.0     16.3      4.8      for n in range(10000):
#     74     10000    3207772.0    320.8     95.2          print('当前n的值是:{}'.format(n))
从运行结果可以看出每行代码的运行时间及比例,注意这里的时间单位是微妙。
heartrate最值得推荐的是可以在网页上面向检测心率一样检测程序的执行过程,同时,
他还是非标准库,使用pip的方式进行安装。
# pip install heartrate
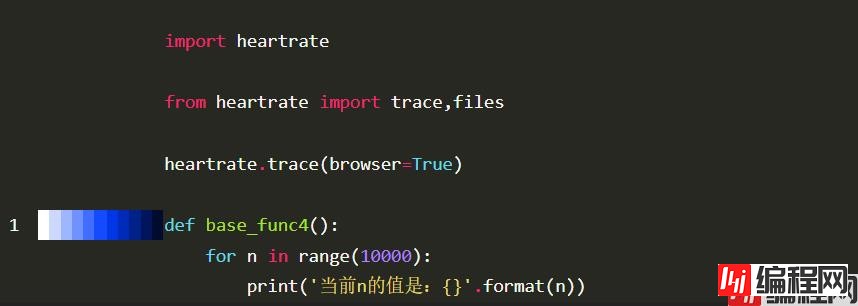
import heartrate
heartrate.trace(browser=True)
def base_func4():
for n in range(10000):
print('当前n的值是:{}'.format(n))运行以后,控制台打印如下日志:
# * Serving flask app "heartrate.core" (lazy loading)
# * Environment: production
# WARNING: This is a development server. Do not use it in a production deployment.
# Use a production WSGI server instead.
# * Debug mode: off
并且自动打开浏览器地址:Http://127.0.0.1:9999
到此这篇关于python性能检测工具函数运行内存及运行时间的文章就介绍到这了,更多相关python性能检测内容请搜索编程网以前的文章或继续浏览下面的相关文章希望大家以后多多支持编程网!
--结束END--
本文标题: python性能检测工具函数运行内存及运行时间
本文链接: https://www.lsjlt.com/news/117747.html(转载时请注明来源链接)
有问题或投稿请发送至: 邮箱/279061341@qq.com QQ/279061341
下载Word文档到电脑,方便收藏和打印~
2024-03-01
2024-03-01
2024-03-01
2024-02-29
2024-02-29
2024-02-29
2024-02-29
2024-02-29
2024-02-29
2024-02-29
回答
回答
回答
回答
回答
回答
回答
回答
回答
回答


官方手机版

微信公众号

商务合作


0