Python 官方文档:入门教程 => 点击学习
前言 python一般使用Matplotlib制作统计图形,用它自己的说法是‘让简单的事情简单,让复杂的事情变得可能'。用它可以制作折线图,直方图,条形图,散点图,饼图,谱图等等你能想到的和想不到的统计图形
前言
python一般使用Matplotlib制作统计图形,用它自己的说法是‘让简单的事情简单,让复杂的事情变得可能'。用它可以制作折线图,直方图,条形图,散点图,饼图,谱图等等你能想到的和想不到的统计图形,这些图形可以导出为多种具有出版质量的格式。此外,它和iPython结合使用,确实方便,谁用谁知道!本文将介绍利用python中的matplotlib画一颗心,感兴趣的朋友们下面来一起看看吧。
安装matplotlib
首先要安装matplotlib
pip install matplotlib
windows用户可以去官网下载安装。官网看到matpltlib的作者John Hunter (1968-2012)刚去世不久,在此感谢他创造了这样一个强大的绘图工具。
上代码
#!/usr/bin/env python3
from mpl_toolkits.mplot3D import Axes3D
from matplotlib import cm
from matplotlib.ticker import LinearLocator, FORMatStrFormatter
import matplotlib.pyplot as plt
import numpy as np
def heart_3d(x,y,z):
return (x**2+(9/4)*y**2+z**2-1)**3-x**2*z**3-(9/80)*y**2*z**3
def plot_implicit(fn, bbox=(-1.5, 1.5)):
''' create a plot of an implicit function
fn ...implicit function (plot where fn==0)
bbox ..the x,y,and z limits of plotted interval'''
xmin, xmax, ymin, ymax, zmin, zmax = bbox*3
fig = plt.figure()
ax = fig.add_subplot(111, projection='3d')
A = np.linspace(xmin, xmax, 100) # resolution of the contour
B = np.linspace(xmin, xmax, 40) # number of slices
A1, A2 = np.meshgrid(A, A) # grid on which the contour is plotted
for z in B: # plot contours in the XY plane
X, Y = A1, A2
Z = fn(X, Y, z)
cset = ax.contour(X, Y, Z+z, [z], zdir='z', colors=('r',))
# [z] defines the only level to plot
# for this contour for this value of z
for y in B: # plot contours in the XZ plane
X, Z = A1, A2
Y = fn(X, y, Z)
cset = ax.contour(X, Y+y, Z, [y], zdir='y', colors=('red',))
for x in B: # plot contours in the YZ plane
Y, Z = A1, A2
X = fn(x, Y, Z)
cset = ax.contour(X+x, Y, Z, [x], zdir='x',colors=('red',))
# must set plot limits because the contour will likely extend
# way beyond the displayed level. Otherwise matplotlib extends the plot limits
# to encompass all values in the contour.
ax.set_zlim3d(zmin, zmax)
ax.set_xlim3d(xmin, xmax)
ax.set_ylim3d(ymin, ymax)
plt.show()
if __name__ == '__main__':
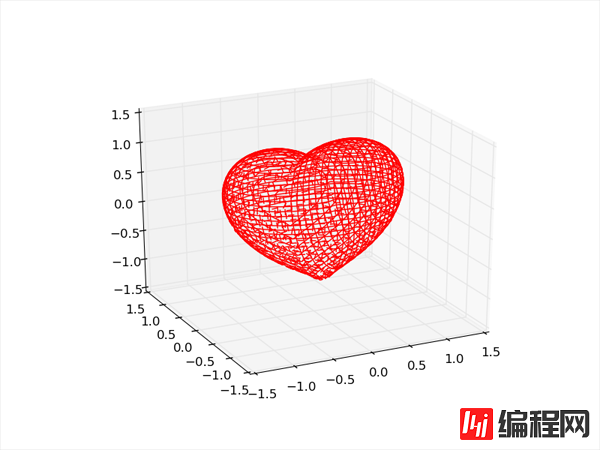
plot_implicit(heart_3d) 效果是这个样子,挺有意思的:
总结
以上就是这篇文章的全部内容了,希望本文的内容对大家学习或者使用python能带来一定的帮助,如果有疑问大家可以留言交流。
--结束END--
本文标题: 利用python画一颗心的方法示例
本文链接: https://www.lsjlt.com/news/13730.html(转载时请注明来源链接)
有问题或投稿请发送至: 邮箱/279061341@qq.com QQ/279061341
下载Word文档到电脑,方便收藏和打印~
2024-03-01
2024-03-01
2024-03-01
2024-02-29
2024-02-29
2024-02-29
2024-02-29
2024-02-29
2024-02-29
2024-02-29
回答
回答
回答
回答
回答
回答
回答
回答
回答
回答


官方手机版

微信公众号

商务合作


0