目录背景实现思路参考代码背景 在工控软件的开发中很多业务场景就是使用图表控件展示设备和工艺参数。如下图案例: 实现思路 通常简单的做法是使用图表控件实现,常用的图表控件有开源的Ze
在工控软件的开发中很多业务场景就是使用图表控件展示设备和工艺参数。如下图案例:
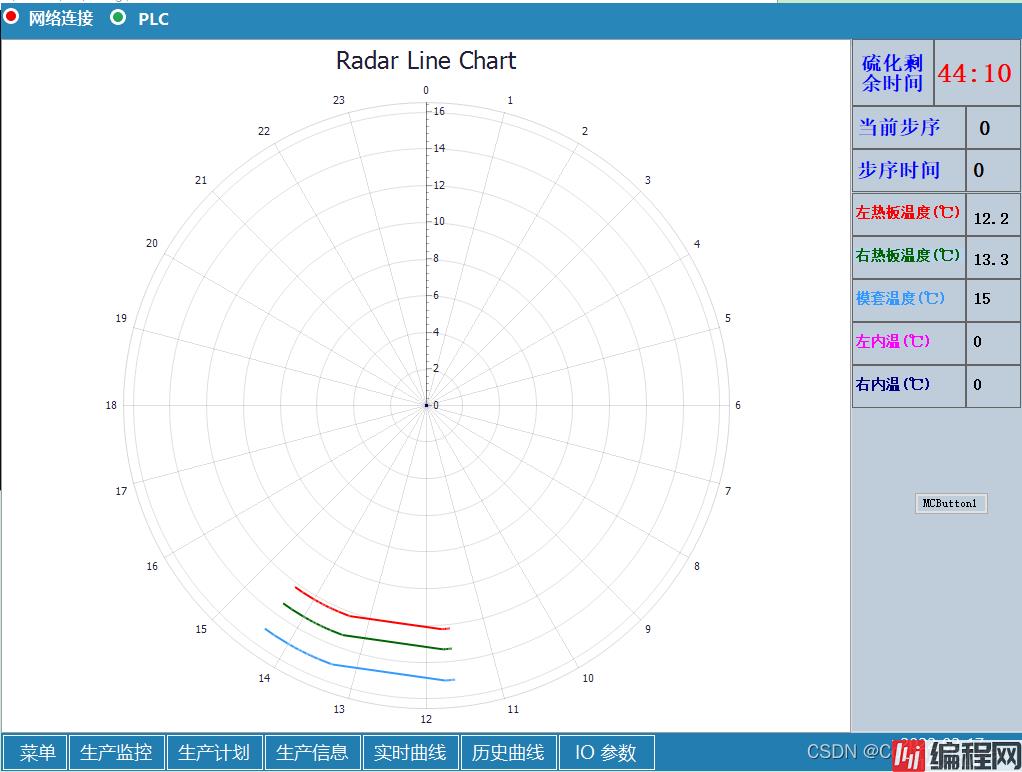
通常简单的做法是使用图表控件实现,常用的图表控件有开源的ZedGraph,还有付费的TeeChart和DevExpress。常规的曲线图、柱状图、饼图的实现,三个控件都可以很好的实现,建议使用开源的ZedGraph。但是在实现雷达图、极坐标图等特定图表时ZedGraph就不能支持,TeeChart用起来也不是那么完美,对比后发现DevExpress的ChartControl实现还是不错的。
本案例是使用的是DevExpress 18.1.3版本,之前在14版本上也试过,但是有一个弊端就是实现极坐标图的时候,第一个点和最后一个点总是自动多一条闭合线,会形成一个闭合的多边形,因此升级了一下版本。在DevExpress中雷达图和极坐标图使用的是父子类的关系,很多属性一致,为了可以自己定义圆盘上的刻度范围,这是采用雷达图实现自定义的极坐标图。
using System;
using System.Collections.Generic;
using System.ComponentModel;
using System.Data;
using System.Drawing;
using System.Linq;
using System.Text;
using System.windows.FORMs;
using System.Diagnostics;
using DevExpress.XtraCharts;

namespace WinTest
{
    public partial class Form1 : Form
    {
        private Stopwatch sw = new Stopwatch();
        public Form1()
        {
            InitializeComponent();
        }

        private void button1_Click(object sender, EventArgs e)
        {
            sw.Restart();

            int fontSize = 9;                   //字号
            int count = 1;                      //曲线数量
            int points = 8;                     //每条曲线的点数
            int angleMaxValue = 24;             //角度最大值
            int maxShowPints = 30;              //最大显示的点数

            for (int i = 0; i < this.Controls.Count; i++)
            {
                if (this.Controls[i] is ChartControl)
                {
                    this.Controls.RemoveAt(i);
                    break;
                }
            }
            // Create a new chart.
            ChartControl RadarLineChart = new ChartControl();

            // Add a radar series to it.
            Series[] seriesArr = new Series[count];
            List<SeriesPoint>[] pintValuesList = new List<SeriesPoint>[count];
            for (int i = 0; i < seriesArr.Length; i++)
            {
                pintValuesList[i] = new List<SeriesPoint>();
                seriesArr[i] = new Series("Series " + i, ViewType.RadarLine);      //使用雷达折线图实例化Series

                RadarLineSeriesView radLineSeriesView = (seriesArr[i].View as RadarLineSeriesView);
                radLineSeriesView.MarkerVisibility = DevExpress.Utils.DefaultBoolean.False;  //去掉线条中的圆点
                radLineSeriesView.Closed = false;           //线条不形成闭环

                RadarLineChart.Series.Add(seriesArr[i]);
            }

            // Flip the diagram (if necessary).
            RadarDiagram radarDiagram = RadarLineChart.Diagram as RadarDiagram;
            radarDiagram.StartAngleInDegrees = 0; //开始的角度
            radarDiagram.AxisX.WholeRange.MinValue = 0;         //设置角度范围最小值
            radarDiagram.AxisX.WholeRange.MaxValue = 23;        //设置角度范围最大值
            radarDiagram.RotationDirection = RadarDiagramRotationDirection.Clockwise; //数据是顺时针还是逆时针


            // Add a title to the chart and hide the legend.
            ChartTitle chartTitle1 = new ChartTitle();
            chartTitle1.Text = "Radar Line Chart";
            RadarLineChart.Titles.Add(chartTitle1);
            RadarLineChart.Legend.Visibility = DevExpress.Utils.DefaultBoolean.False;       //隐藏图例

            // Add the chart to the form.
            RadarLineChart.Dock = DockStyle.Fill;
            this.Controls.Add(RadarLineChart);

            // Populate the series with points.
            Random r = new Random((int)DateTime.Now.Ticks);
            r.NextDouble();
            for (int i = 0; i < seriesArr.Length; i++)
            {
                for (int k = 0; k < points; k++)
                {
                    double yValue = 100 * r.NextDouble();
                    pintValuesList[i].Add(new SeriesPoint(k * 24.0 / points, yValue));
                }
                seriesArr[i].Points.AddRange(pintValuesList[i].ToArray());
                seriesArr[i].LabelsVisibility = DevExpress.Utils.DefaultBoolean.False;      //隐藏数据点的标签显示
            }
        }
    }
}
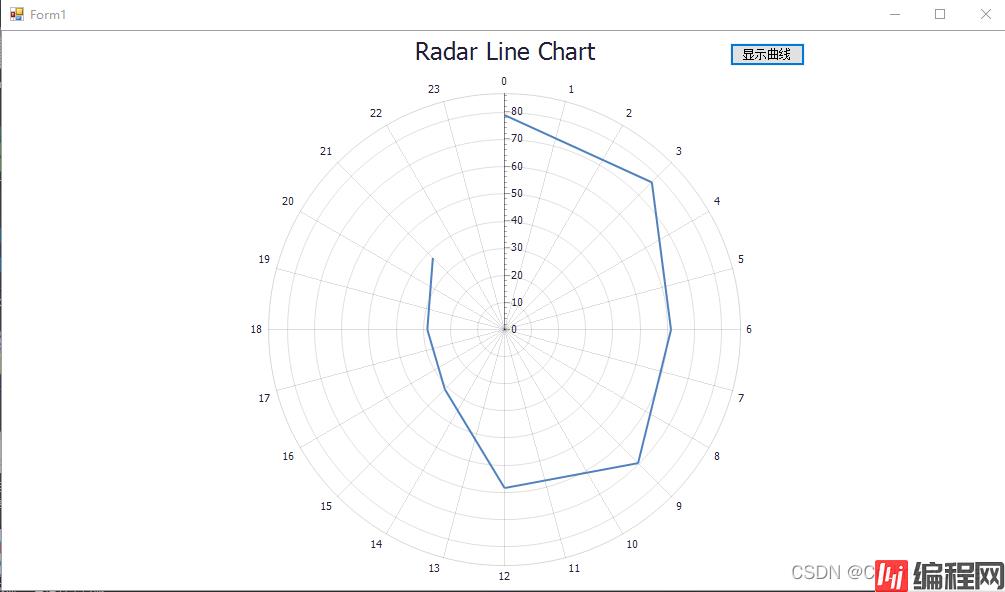
运行效果图,如下:
到此这篇关于在C#中使用DevExpress中的ChartControl实现极坐标图的文章就介绍到这了,更多相关C# ChartControl极坐标图内容请搜索编程网以前的文章或继续浏览下面的相关文章希望大家以后多多支持编程网!
--结束END--
本文标题: C#中使用DevExpress中的ChartControl实现极坐标图的案例详解
本文链接: https://www.lsjlt.com/news/139892.html(转载时请注明来源链接)
有问题或投稿请发送至: 邮箱/279061341@qq.com QQ/279061341
下载Word文档到电脑,方便收藏和打印~
2024-03-01
2024-03-01
2024-02-29
2024-02-29
2024-02-29
2024-02-29
2024-02-29
2024-02-29
2024-02-29
2024-02-29
回答
回答
回答
回答
回答
回答
回答
回答
回答
回答
一口价域名售卖能注册吗?域名是网站的标识,简短且易于记忆,为在线用户提供了访问我们网站的简单路径。一口价是在域名交易中一种常见的模式,而这种通常是针对已经被注册的域名转售给其他人的一种方式。
一口价域名买卖的过程通常包括以下几个步骤:
1.寻找:买家需要在域名售卖平台上找到心仪的一口价域名。平台通常会为每个可售的域名提供详细的描述,包括价格、年龄、流
443px" 443px) https://www.west.cn/docs/wp-content/uploads/2024/04/SEO图片294.jpg https://www.west.cn/docs/wp-content/uploads/2024/04/SEO图片294-768x413.jpg 域名售卖 域名一口价售卖 游戏音频 赋值/切片 框架优势 评估指南 项目规模

官方手机版

微信公众号

商务合作


0