Python 官方文档:入门教程 => 点击学习
目录1.写在前面2.SpringBoot Actuator3.定制化Endpoint3.1 定制health端点信息3.2 定制info端点信息1.写在前面 首先肯定要说一下spri
首先肯定要说一下springBoot的四大核心了:
这篇文章呢,我来和大家聊聊指标监控这个东西。
未来每一个微服务在云上部署以后,我们都需要对其进行监控、追踪、审计、控制等。SpringBoot就抽取了Actuator场景,使得我们每个微服务快速引用即可获得生产级别的应用监控、审计等功能。
要开启指标监控功能,首先需要在pom文件种添加如下依赖:
<dependency>
    <groupId>org.springframework.boot</groupId>
    <artifactId>spring-boot-starter-actuator</artifactId>
</dependency>
然后在配置文件中先做如下配置:
server:
  port: 8080

# 暴露所有监控信息为Http
management:
  endpoints:
    enabled-by-default: true # 默认开启所有监控端点信息
    WEB:
      exposure:
include: '*' # 以web方式暴露所有端点然后启动项目,进行测试:
下图中测试得到的内容就是目前项目中可以监控到的各种指标参数信息。
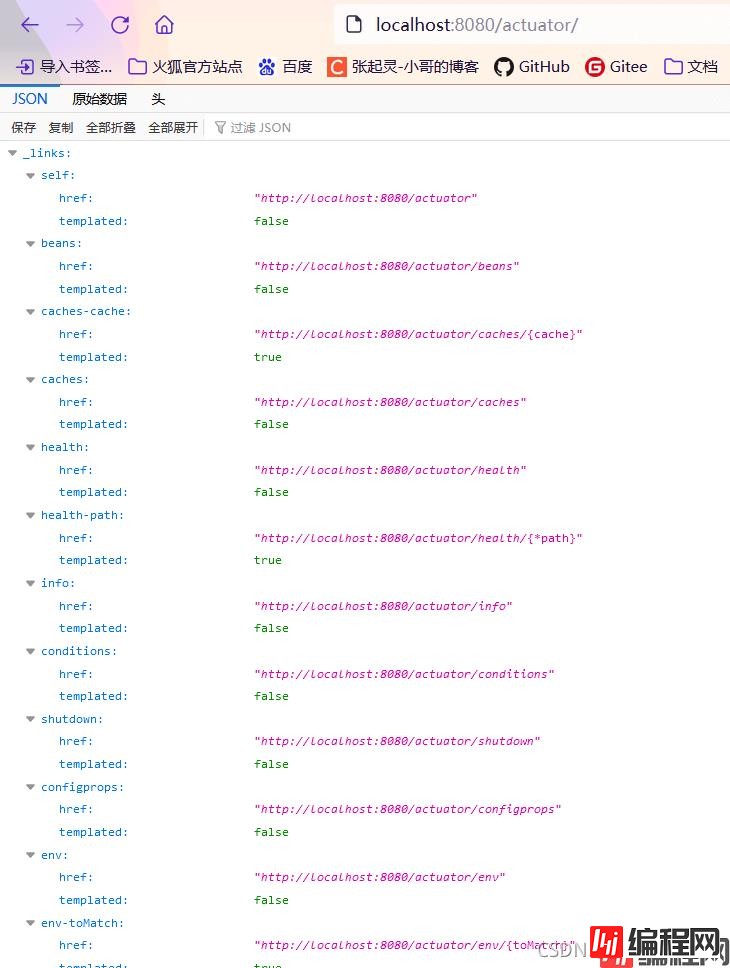
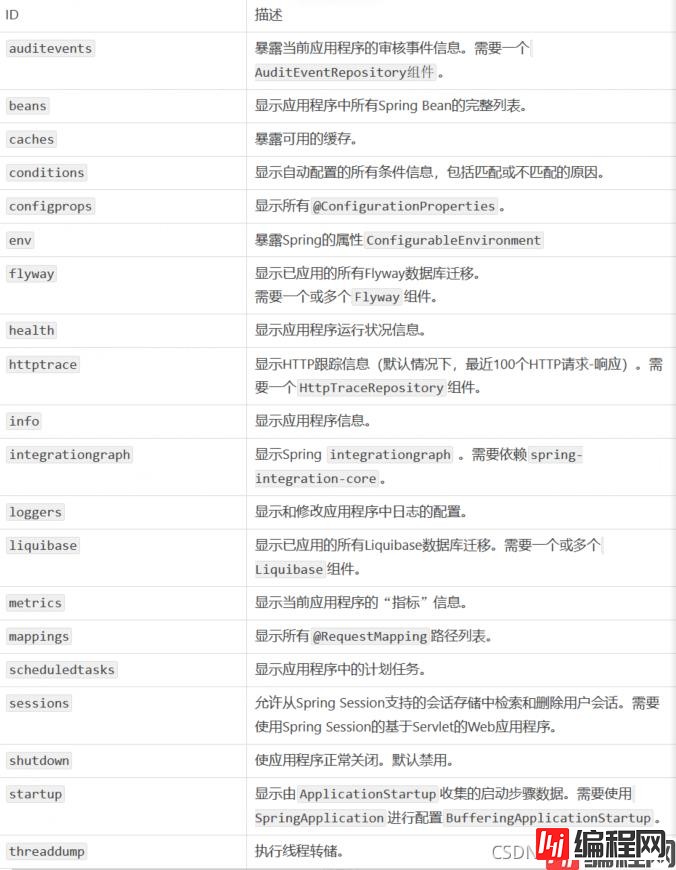
在指标监控这个功能中,有一个经常提到的词叫:端点。那么常用常见的端点如下图:👇👇👇
上面我们访问指标监控的url是:http://localhost:8080/actuator/ 即可获取到所有端点信息。那么如果想要获取某个端点信息,url就应该是:
http://localhost:8080/actuator/endpointName/detailPath。
健康检查端点,我们一般用于在云平台,平台会定时的检查应用的健康状况,我们就需要Health Endpoint可以为平台返回当前应用的一系列组件健康状况的集合。
重要的几点:


提供详细的、层级的、空间指标信息,这些信息可以被pull(主动推送)或者push(被动获取)方式得到;
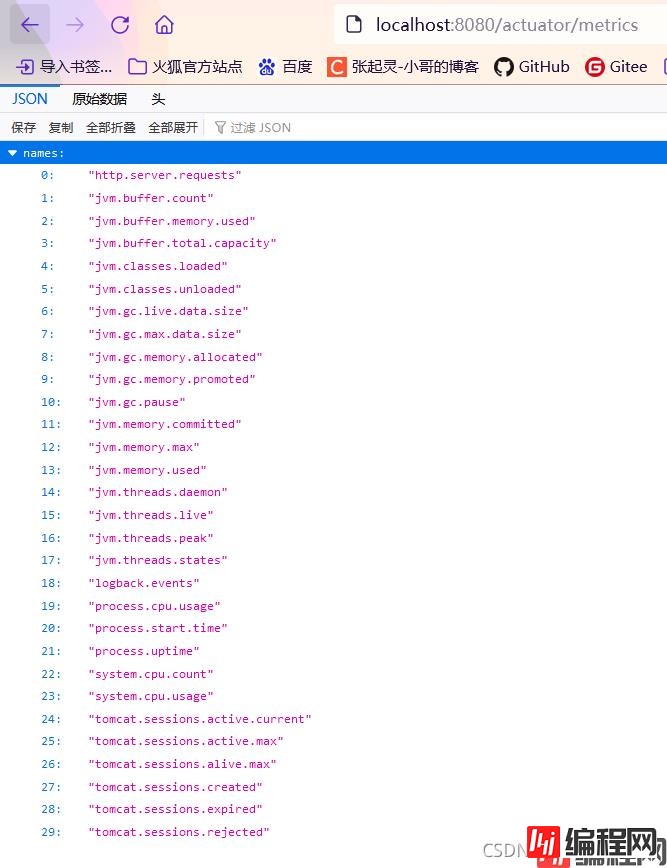

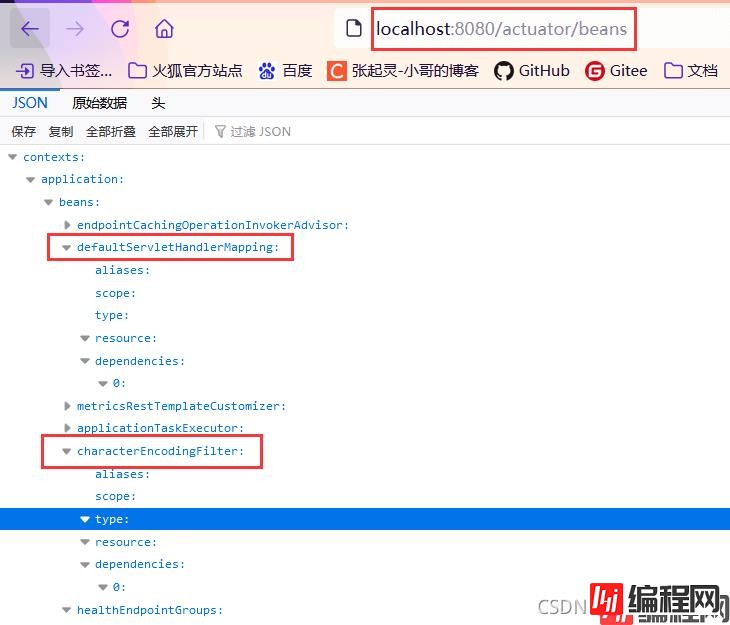
上面的这些测试结果就是我们根据当前项目,获取到某个端点的详细指标信息。
除此之外,我们也可以对这些端点进行手动开启或者禁用。(参见下面的配置文件)
server:
  port: 8080

# 暴露所有监控信息为HTTP
management:
  endpoints:
    enabled-by-default: false # 默认开启所有监控端点信息
    web:
      exposure:
        include: '*' # 以web方式暴露所有端点
# 需要开启或者禁用某个Endpoint
# 配置模式为 management.endpoint.<endpointName>.enabled = true/false
  endpoint:
    health:
      show-details: always # 总是显示health端点的详细信息
      enabled: true
    info:
      enabled: true
    beans:
      enabled: true


上面的测试截图就是我们手动的开启某些端点、同时关闭了某些端点之后的结果。
以上的所有内容都是在使用SpringBoot为我们提供的官方的Endpoint,那么我们也是可以自定义Endpoint的(也即定制化Endpoint)。
有两种方式:①继承AbstractHealthIndicator抽象类(doHealthCheck(Health.Builder builder)方法);②实现HealthIndicator接口(重写health()方法)。我是用第一种方法简单做个测试吧。
package com.szh.boot.health;

import org.springframework.boot.actuate.health.AbstractHealthIndicator;
import org.springframework.boot.actuate.health.Health;
import org.springframework.boot.actuate.health.Status;
import org.springframework.stereotype.Component;

import java.util.HashMap;
import java.util.Map;


@Component
public class MyComHealthIndicator extends AbstractHealthIndicator {


    @Override
    protected void doHealthCheck(Health.Builder builder) throws Exception {
        Map<String,Object> map = new HashMap<>();
        //模拟检查过程
        if (1 == 1) {
//            builder.up(); //健康
            builder.status(Status.UP);
            map.put("count",1);
            map.put("ms",100);
        } else {
//            builder.down(); //宕机
            builder.status(Status.DOWN);
            map.put("error","连接超时");
            map.put("ms",3000);
        }

        builder.withDetail("code",20001)
                .withDetails(map);
    }
}
配置文件如下:👇👇👇
server:
port: 8080
# 暴露所有监控信息为HTTP
management:
endpoints:
enabled-by-default: false # 默认开启所有监控端点信息
web:
exposure:
include: '*' # 以web方式暴露所有端点
# 需要开启或者禁用某个Endpoint
# 配置模式为 management.endpoint.<endpointName>.enabled = true/false
endpoint:
health:
show-details: always # 总是显示health端点的详细信息
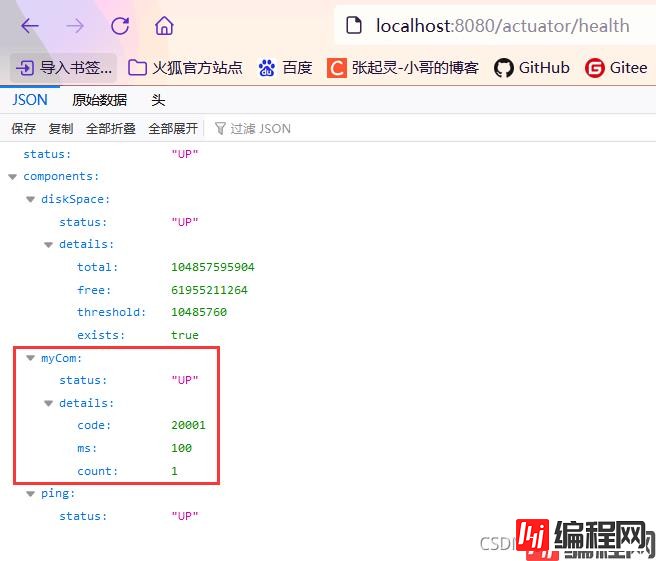
enabled: true然后我们启动测试,访问路径:http://localhost:8080/actuator/health。从结果中看到有一个端点myCom就是我们自定义的(命名方式就是 MyComHealthIndicator 类去掉后面的 HealthIndicator)。
首先在配置文件中添加如下内容:(最后几行)
server:
  port: 8080

# 暴露所有监控信息为HTTP
management:
  endpoints:
    enabled-by-default: false # 默认开启所有监控端点信息
    web:
      exposure:
        include: '*' # 以web方式暴露所有端点
# 需要开启或者禁用某个Endpoint
# 配置模式为 management.endpoint.<endpointName>.enabled = true/false
  endpoint:
    health:
      show-details: always # 总是显示health端点的详细信息
      enabled: true
    info:
      enabled: true
    beans:
      enabled: true
info:
  appName: spring-boot-actuator-endpoint-info
  version: 2.0.0
  MavenProjectName: @project.artifactId@
  mavenProjectVersion: @project.version@
然后创建一个类,实现 InfoContributor 这个接口,并且重写接口中的 contribute(Info.Builder builder) 方法。
package com.szh.boot.info;

import org.springframework.boot.actuate.info.Info;
import org.springframework.boot.actuate.info.InfoContributor;
import org.springframework.stereotype.Component;

import java.util.Collections;


@Component
public class ExampleInfoContributor implements InfoContributor {

    @Override
    public void contribute(Info.Builder builder) {
        builder.withDetail("example", Collections.singletonMap("key","value"));
    }

}
最后我们启动测试一下,访问路径:http://localhost:8080/actuator/info。得到的数据就是我们上面通过代码写好的内容。

到此这篇关于SpringBoot 指标监控actuator的专题的文章就介绍到这了,更多相关SpringBoot 指标监控内容请搜索编程网以前的文章或继续浏览下面的相关文章希望大家以后多多支持编程网!
--结束END--
本文标题: SpringBoot 指标监控actuator的专题
本文链接: https://www.lsjlt.com/news/157406.html(转载时请注明来源链接)
有问题或投稿请发送至: 邮箱/279061341@qq.com QQ/279061341
下载Word文档到电脑,方便收藏和打印~
2024-03-01
2024-03-01
2024-03-01
2024-02-29
2024-02-29
2024-02-29
2024-02-29
2024-02-29
2024-02-29
2024-02-29
回答
回答
回答
回答
回答
回答
回答
回答
回答
回答


官方手机版

微信公众号

商务合作


0