Python 官方文档:入门教程 => 点击学习
目录原理点画法(实心)代码运行效果点画法(空心)代码运行效果折线画法 (线团)代码运行效果等高线画法(线框)代码运行效果原理 1.使用python中的mtplotlib库。 2.立体
1.使用python中的mtplotlib库。
2.立体爱心面公式

import matplotlib.pyplot as plt #导入绘图模块
from mpl_toolkits.mplot3D import Axes3D #3d绘图模块
import numpy as np #导入数值计算拓展模块

#start generating points
x_lim=np.linspace(-10,10,150)
y_lim=np.linspace(-10,10,150)
z_lim=np.linspace(-10,10,150)
X_points=[] #用来存放绘图点X坐标
Y_points=[] #用来存放绘图点Y坐标
Z_points=[] #用来存放绘图点Z坐标
for x in x_lim:
    for y in y_lim:
        for z in z_lim:
            if (x**2+(9/4)*y**2+z**2-1)**3-(9/80)*y**2*z**3-x**2*z**3<=0:
                X_points.append(x)
                Y_points.append(y)
                Z_points.append(z)

plt.style.use('seaborn')
fig=plt.figure()
ax=fig.add_subplot(111,projection='3d')
ax.scatter(X_points,Y_points,Z_points,color="red")
plt.show()
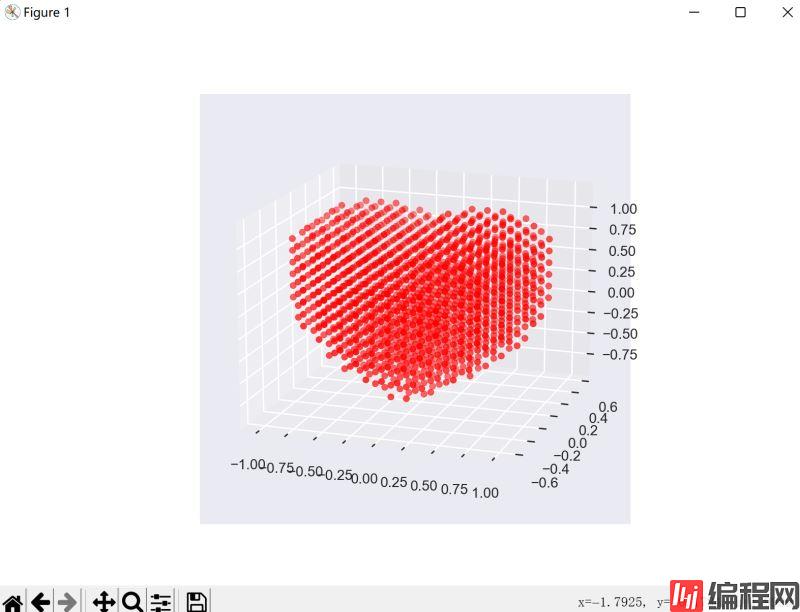
这个画法侧面看起来很无语。

import matplotlib.pyplot as plt #导入绘图模块
from mpl_toolkits.mplot3d import Axes3D #3d绘图模块
import numpy as np #导入数值计算拓展模块

#start generating points
x_lim=np.linspace(-10,10,200)
y_lim=np.linspace(-10,10,200)
z_lim=np.linspace(-10,10,200)
X_points=[] #用来存放绘图点X坐标
Y_points=[] #用来存放绘图点Y坐标
Z_tmp=[]
Z_points=[] #用来存放绘图点Z坐标
for y in y_lim:
    for x in x_lim:
        for z in z_lim:
            k=(x**2+(9/4)*y**2+z**2-1)**3-(9/80)*y**2*z**3-x**2*z**3
            if k<=0 :
                Z_tmp.append(z)
                if y<=-0.55 or y>=0.55:
                    X_points.append(x)
                    Y_points.append(y)
                    Z_points.append(z)
        if Z_tmp:
            X_points.append(x)
            Y_points.append(y)
            Z_points.append(max(Z_tmp))
            X_points.append(x)
            Y_points.append(y)
            Z_points.append(min(Z_tmp))
            Z_tmp.clear()

plt.style.use('seaborn')
fig=plt.figure()
ax=fig.add_subplot(111,projection='3d')
ax.set_zlim(-1, 1)
ax.set_xlim(-1, 1)
ax.set_ylim(-1, 1)
ax.scatter(X_points,Y_points,Z_points)

plt.show()

import matplotlib.pyplot as plt #导入绘图模块
from mpl_toolkits.mplot3d import Axes3D #3d绘图模块
import numpy as np #导入数值计算拓展模块

#start generating points
x_lim=np.linspace(-10,10,150)
y_lim=np.linspace(-10,10,150)
z_lim=np.linspace(-10,10,150)
X_points=[] #用来存放绘图点X坐标
Y_points=[] #用来存放绘图点Y坐标
Z_tmp=[]
Z_points=[] #用来存放绘图点Z坐标
for y in y_lim:
    for x in x_lim:
        for z in z_lim:
            k=(x**2+(9/4)*y**2+z**2-1)**3-(9/80)*y**2*z**3-x**2*z**3
            if k<=0 :
                Z_tmp.append(z)
                if y<=-0.55 or y>=0.55:
                    X_points.append(x)
                    Y_points.append(y)
                    Z_points.append(z)
        if Z_tmp:
            X_points.append(x)
            Y_points.append(y)
            Z_points.append(max(Z_tmp))
            X_points.append(x)
            Y_points.append(y)
            Z_points.append(min(Z_tmp))
            Z_tmp.clear()

plt.style.use('seaborn')
fig=plt.figure()
ax=fig.add_subplot(111,projection='3d')
ax.set_zlim(-1, 1)
ax.set_xlim(-1, 1)
ax.set_ylim(-1, 1)
ax.plot(X_points,Y_points,Z_points)

plt.show()

from mpl_toolkits.mplot3d import Axes3D
from matplotlib import cm
from matplotlib.ticker import LinearLocator, FORMatStrFormatter
import matplotlib.pyplot as plt
import numpy as np


def heart_3d(x, y, z):
    return (x**2+(9/4)*y**2+z**2-1)**3-x**2*z**3-(9/80)*y**2*z**3


def plot_implicit(fn, bbox=(-1.5, 1.5)):
    xmin, xmax, ymin, ymax, zmin, zmax = bbox*3
    fig = plt.figure()
    ax = fig.add_subplot(projection='3d')
    A = np.linspace(xmin, xmax, 100)  # resolution of the contour
    B = np.linspace(xmin, xmax, 10)  # number of slices
    A1, A2 = np.meshgrid(A, A)  # grid on which the contour is plotted

    for z in B:  # plot contours in the XY plane
        X, Y = A1, A2
        Z = fn(X, Y, z)
        cset = ax.contour(X, Y, Z+z, [z], zdir='z', colors=('r',))

    for y in B:  # plot contours in the XZ plane
        X, Z = A1, A2
        Y = fn(X, y, Z)
        cset = ax.contour(X, Y+y, Z, [y], zdir='y', colors=('red',))

    for x in B:  # plot contours in the YZ plane
        Y, Z = A1, A2
        X = fn(x, Y, Z)
        cset = ax.contour(X+x, Y, Z, [x], zdir='x', colors=('red',))

    # must set plot limits because the contour will likely extend
    # way beyond the displayed level. Otherwise matplotlib extends the plot limits
    # to encompass all values in the contour.
    ax.set_zlim3d(zmin, zmax)
    ax.set_xlim3d(xmin, xmax)
    ax.set_ylim3d(ymin, ymax)

    plt.show()


if __name__ == '__main__':
    plot_implicit(heart_3d)
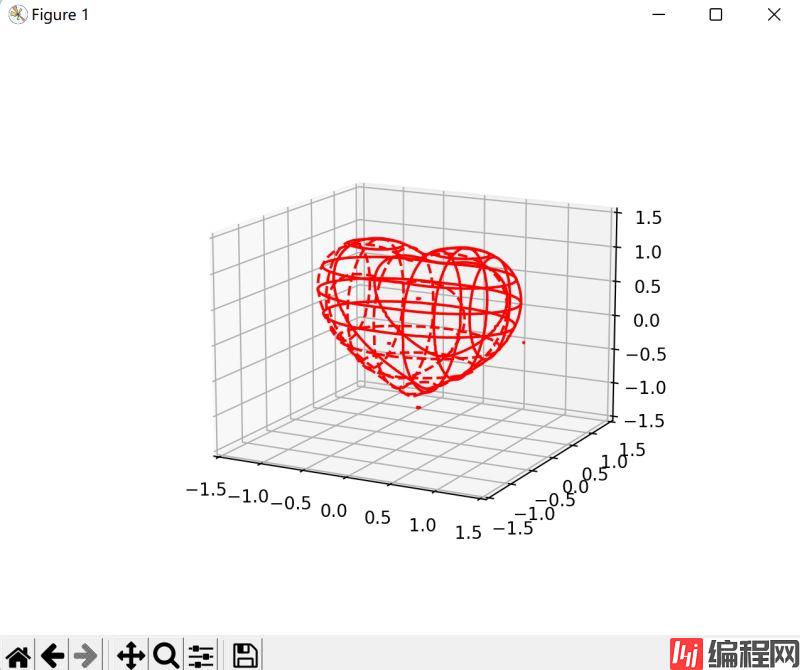
以上代码整理于网络,需要的小伙伴可以参考一下
到此这篇关于基于Python绘制3D立体爱心图案的示例详解的文章就介绍到这了,更多相关Python绘制3D立体爱心内容请搜索编程网以前的文章或继续浏览下面的相关文章希望大家以后多多支持编程网!
--结束END--
本文标题: 基于Python绘制3D立体爱心图案的示例详解
本文链接: https://www.lsjlt.com/news/173048.html(转载时请注明来源链接)
有问题或投稿请发送至: 邮箱/279061341@qq.com QQ/279061341
下载Word文档到电脑,方便收藏和打印~
2024-03-01
2024-03-01
2024-03-01
2024-02-29
2024-02-29
2024-02-29
2024-02-29
2024-02-29
2024-02-29
2024-02-29
回答
回答
回答
回答
回答
回答
回答
回答
回答
回答


官方手机版

微信公众号

商务合作


0