


昨天学习pandas和matplotlib的过程中, 在jupyter notebook遇到ImportError: matplotlib is required for plotting错误, 以下是解决该问题的具体描述, 在此记录, 给后面学习的朋友提供一个参考.
环境
win8.1, python3.7, jupyter notebook
问题描述
1 import pandas as pd
2 import matplotlib.pyplot as plt
3 df = pd.read_csv(r"D:\Data\percent-bachelors-degrees-women-usa.csv")
4 df.plot(x = "Year", y = "Agriculture")
5 plt.xlabel("Year")
6 plt.ylabel("Percentage")
7 plt.show()
在jupyter notebook中执行上述代码, 抛出以下错误:
ImportError: matplotlib is required for plotting
解决思路
1. 不能导入matplotlib?在cmd命令窗口下确认:
没有报错, 说明安装成功, 而且能够被成功导入.
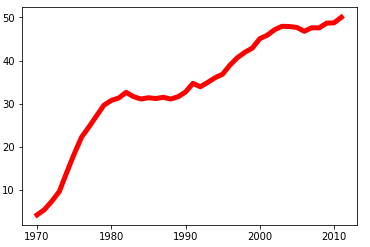
2. 尝试其他方式: 之前用的是pandas中plot()方法绘图, 换成matplotlib.pyplot中的plot()方法
1 import pandas as pd
2 import matplotlib.pyplot as plt
3 df = pd.read_csv(r"D:\Data\percent-bachelors-degrees-women-usa.csv")
4 df_year, df_Agriculture = df["Year"], df["Agriculture"]
5 plt.plot(df_year, df_Agriculture,"-", color = "r", linewidth = 5)
6 plt.show()
在jupyter notebook中能够成功运行:
再次运行pandas的plot()方法, 仍然报错, 而且再次检查没有发现语句中存在错误.
那么问题来了, 为什么pandas中的plot()方法不能用?
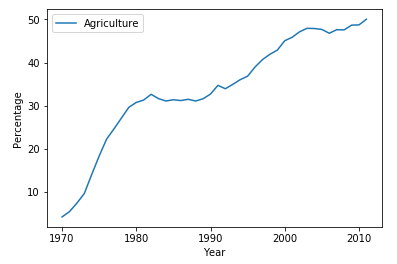
3. 换IDE试试, 看看在PyCharm中能不能运行:
1 import pandas as pd
2 import matplotlib.pyplot as plt
3 df = pd.read_csv(r"D:\Data\percent-bachelors-degrees-women-usa.csv")
4 df.plot(x = "Year", y = "Agriculture")
5 plt.xlabel("Year")
6 plt.ylabel("Percentage")
7 plt.show()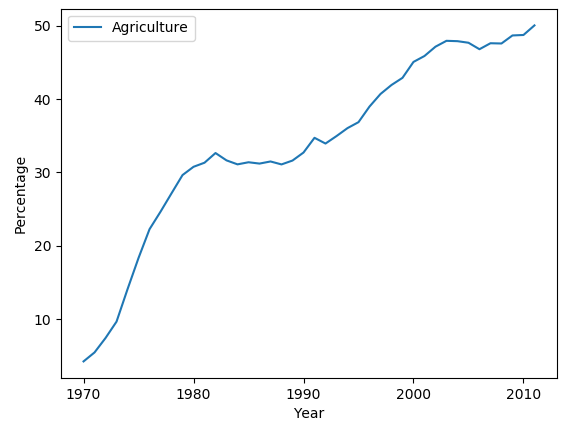
在pycharm中能够成功运行, 而在jupyter notebook中不能运行, 看起是IDE的问题, 那么两者存在什么差异呢:
就我个人电脑而言, pycharm是我刚刚启动的(安装好matplotlib后), 而jupyter notebook已经好几天没有关闭过了(安装matplotlib前后都没有关闭过), 为了确保两者条件统一, 试着重启下jupyter notebook.
重启jupyter notebook成功之后再次运行代码:
1 import pandas as pd
2 import matplotlib.pyplot as plt
3 df = pd.read_csv(r"D:\Data\percent-bachelors-degrees-women-usa.csv")
4 df.plot(x = "Year", y = "Agriculture")
5 plt.xlabel("Year")
6 plt.ylabel("Percentage")
7 plt.show()
能够成功显示:
看起来问题出在: 安装matplotlib之后没有重启jupyter notebook.
总结
个人猜想: 在使用pandas中的plot()方法时, matplotlip里的pyplot绘图框架仅仅是用来展示图形的, 而要想让两者实现交互, 那应该确保在启动IDE之前两者都被成功安装.
如果在之后遇到类似问题, 在确保代码无误的情况下, 直接尝试重启下IDE有时能更快解决问题.


0