1、安装 npm install echarts --save 2、在Vue中引入(全局引入) // 引入echarts import echarts from 'echarts'
npm install echarts --save
// 引入echarts
import echarts from 'echarts'
Vue.prototype.$echarts = echarts需要用到echart的地方先设置一个div的id、宽高
提示:
可以在一个页面中引入多个数据报表模板
使用div进行位置的排版放置
重点注意:其中const option = { }就是我们需要引进echart图表的代码
<template>
  <div>
    <div ref="chart"></div>
  </div>
</template>要在mounted生命周期函数中实例化echarts对象。确保dom元素已经挂载到页面中。
mounted(){
    this.getEchartData()
    },
   methods: {
    getEchartData() {
      const chart = this.$refs.chart
      if (chart) {
        const myChart = this.$echarts.init(chart)
        const option = {...}
        myChart.setOption(option)
        window.addEventListener("resize", function() {
          myChart.resize()
        })
      }
       this.$on('hook:destroyed',()=>{
         window.removeEventListener("resize", function() {
          myChart.resize();
        });
        })
    }
}<template>
<div>
<div ref="chart"></div>
<div ref="chart1"></div>
</div>
</template>
<script>
export default {
data() {
},
mounted() {
this.getEchartData()
this.getEchartData1()
},
methods: {
getEchartData() {
const chart = this.$refs.chart
if (chart) {
const myChart = this.$echarts.init(chart)
const option = { legend: {},
tooltip: {},
dataset: {
source: [
['订单', 43.3, 85.8],
['订单1', 83.1, 73.4],
['订单2', 86.4, 65.2],
['订单3', 72.4, 53.9],
['订单4', 82.4, 53.9],
['订单5', 42.4, 53.9],
['订单6', 72.4, 53.9],
['订单7', 72.4, 53.9]
]
},
xAxis: { type: 'cateGory' },
yAxis: {},
series: [ { type: 'bar' }, { type: 'bar' }]}
myChart.setOption(option)
window.addEventListener("resize", function() {
myChart.resize()
})
}
this.$on('hook:destroyed',()=>{
window.removeEventListener("resize", function() {
myChart.resize();
});
})
},
getEchartData1() {
const chart1 = this.$refs.chart1
if (chart1) {
const myChart = this.$echarts.init(chart1)
const option = {
title: {
text: 'Stacked Line'
},
tooltip: {
trigger: 'axis'
},
legend: {
data: ['Email', 'UNIOn Ads', 'Video Ads', 'Direct', 'Search Engine']
},
grid: {
left: '3%',
right: '4%',
bottom: '3%',
containLabel: true
},
toolbox: {
feature: {
saveAsImage: {}
}
},
xAxis: {
type: 'category',
boundaryGap: false,
data: ['一月', '二月', '三月', '四月', '五月', '六月', '七月','八月','九月','十月','十一月','十二月']
},
yAxis: {
type: 'value'
},
series: [
{
name: 'Email',
type: 'line',
stack: 'Total',
data: [120, 132, 101, 134, 90, 230, 210,120, 132, 101, 134, 90, 230]
},
{
name: 'Union Ads',
type: 'line',
stack: 'Total',
data: [220, 182, 191, 234, 290, 330, 310,220, 182, 191, 234, 290, 330]
},
{
name: 'Video Ads',
type: 'line',
stack: 'Total',
data: [150, 232, 201, 154, 190, 330, 410,150, 232, 201, 154, 190, 330]
},
{
name: 'Direct',
type: 'line',
stack: 'Total',
data: [320, 332, 301, 334, 390, 330, 320,320, 332, 301, 334, 390, 330]
},
{
name: 'Search Engine',
type: 'line',
stack: 'Total',
data: [820, 932, 901, 934, 1290, 1330, 1320,820, 932, 901, 934, 1290, 1330]
}
]
}
myChart.setOption(option)
window.addEventListener("resize", function() {
myChart.resize()
})
}
this.$on('hook:destroyed',()=>{
window.removeEventListener("resize", function() {
myChart.resize();
});
})
},
},
watch: {},
created() {
}
}
</script>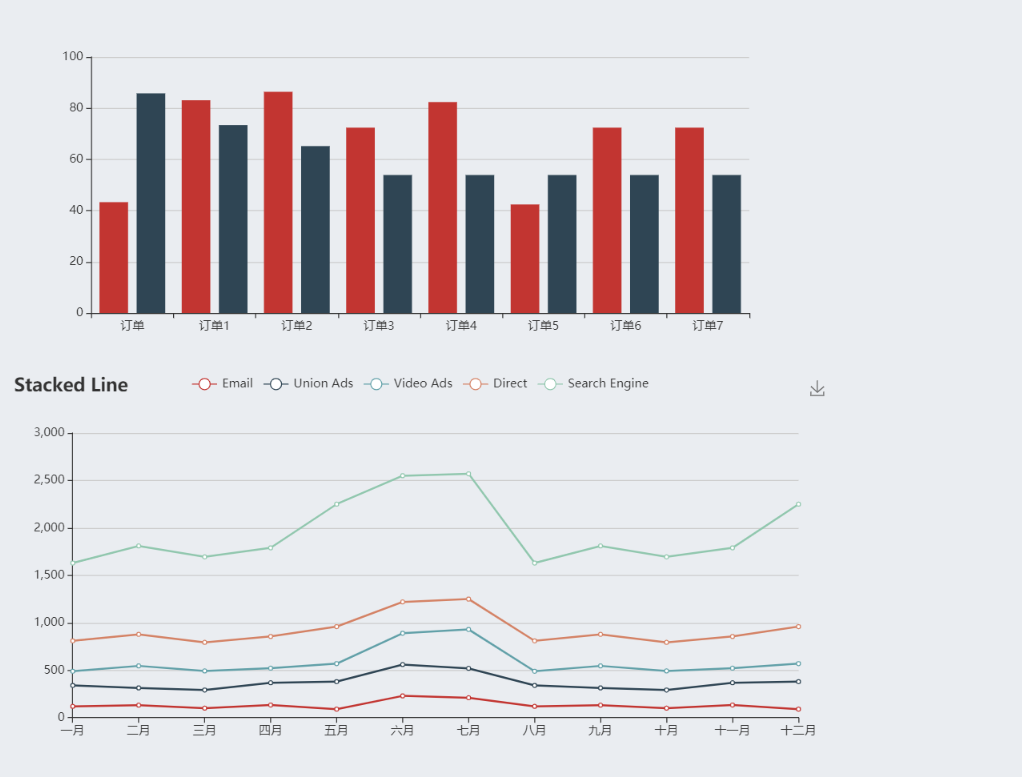
cnpm install echarts --save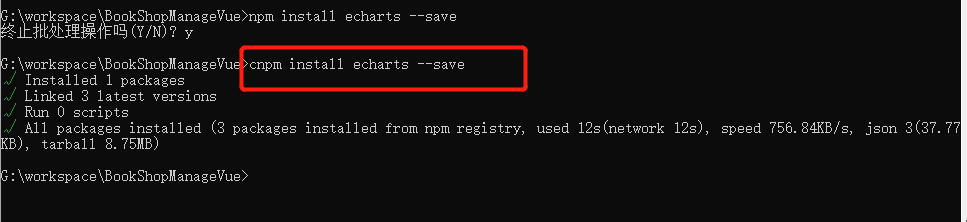
修改引入的方式
// 引入echarts
import *as echarts from 'echarts'
Vue.prototype.$echarts = echarts--结束END--
本文标题: vue中使用echarts的方法实例详解
本文链接: https://www.lsjlt.com/news/213404.html(转载时请注明来源链接)
有问题或投稿请发送至: 邮箱/279061341@qq.com QQ/279061341
下载Word文档到电脑,方便收藏和打印~
2024-01-12
2023-05-20
2023-05-20
2023-05-20
2023-05-20
2023-05-20
2023-05-20
2023-05-20
2023-05-20
2023-05-20
回答
回答
回答
回答
回答
回答
回答
回答
回答
回答


官方手机版

微信公众号

商务合作


0