AspNet Core下如何利用app-metrics+Grafana + InfluxDB实现高大上的性能监控界面,针对这个问题,这篇文章详细介绍了相对应的分析和解答,希望可以帮助更多想解决这个问题的小伙伴找到更简单易行的方法。在日常系统
AspNet Core下如何利用app-metrics+Grafana + InfluxDB实现高大上的性能监控界面,针对这个问题,这篇文章详细介绍了相对应的分析和解答,希望可以帮助更多想解决这个问题的小伙伴找到更简单易行的方法。
在日常系统工作中,我们为了洞察系统的问题和运作情况通常会记录日志的方式来进行分析,但是在很多情况下都是被动的在出问题后才会去查日志。在很多时候,我们可能更需要相对实时的了解整个系统或者某一时段的运行的情况,诸如系统出错的频率以及响应时间等等指标。这些动态的准实时信息对于监控整个系统的运行和健康状况非常重要,而本文的主角们能通过很好的配合帮助你实现这个目标,而且是一种高大上的实现方式。想想泡杯茶翘着二郎腿看着偌大的屏幕上有着一堆华丽的仪表和曲线图,即使看不懂也很牛B的样子啊!(谁知道我看得懂看不懂呢,是不是?)
Q: 那什么是App-Metrics?
A: App Metrics是一个开源和跨平台的.net库,用于记录应用程序中各项指标。可以在.net core上运行,也可以在支持.NET 4.5.2的完整.NET框架上运行。
App Metrics对底层数据源做了很好的抽象以支持很多类型的数据库,例如:
InfluxDb、prometheus、elasticsearch等等。。
同时他又提供了很多Measurements比如Apdex, Gauges, Counters, Meters, Histograms 等等一大堆
Q: 什么是Grafana?
A: 一个类似Kibana的可视化数据开源程序,一般配合时间序列数据库进行配合来展示数据
这里为了方便使用Docker来运行Grafana
docker run -d --name=grafana -p 3000:3000 grafana/grafana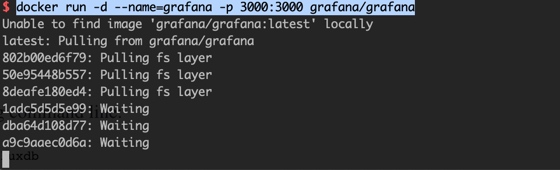 

接着我们确认下是否正常运行了
docker ps -a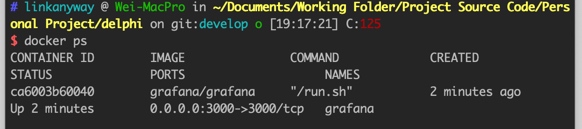 

InfluxDb是比较流行的时序数据库,可以根据需要替换成Prometheus同上为了方便我们还是使用docker来运行
如果你希望每次都能保持之前docker运行收集的数据可以用docker 的-v选项把目录映射到本机的目录以便持久化数据
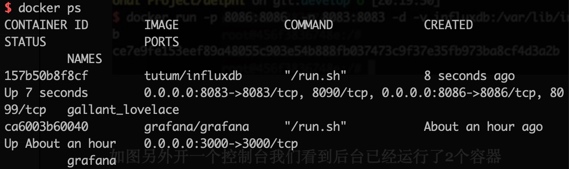
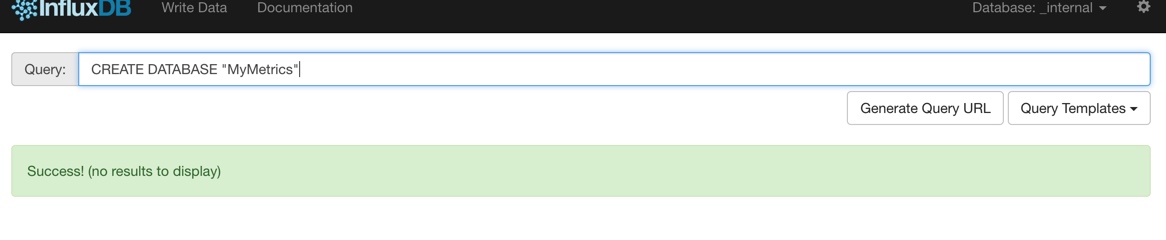
==注意influxdb有2个端口一个是admin一个database==docker run -d -p 8083:8083 -p 8086:8086 --expose 8090 --expose 8099 tutum/influxdb如图另外开一个控制台我们看到后台已经运行了2个容器

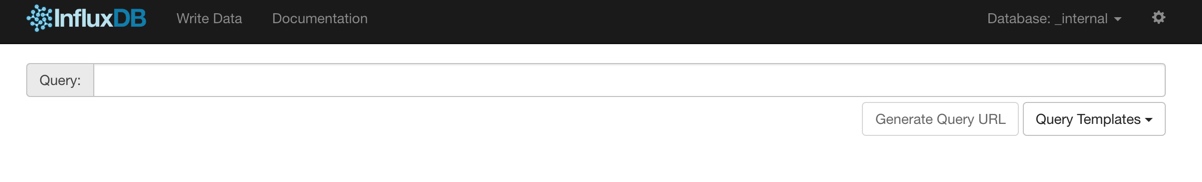
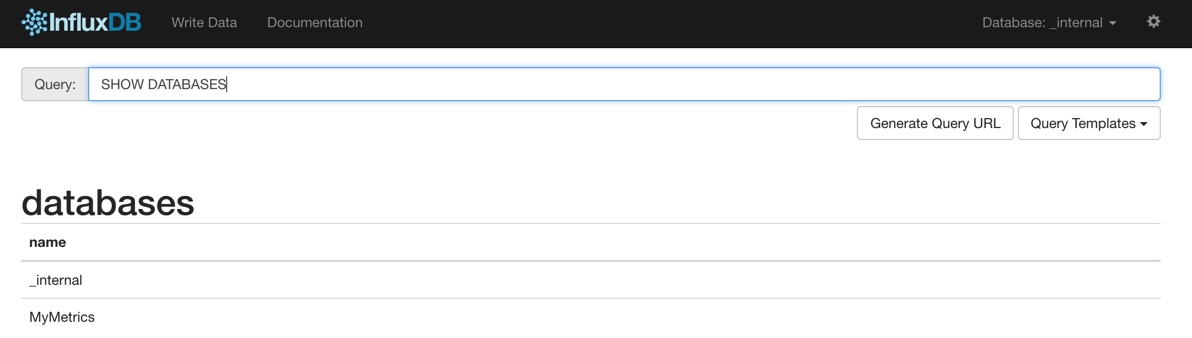
输入Http://127.0.0.1:8083/ 访问InfluxDb的控制界面以便创建数据库


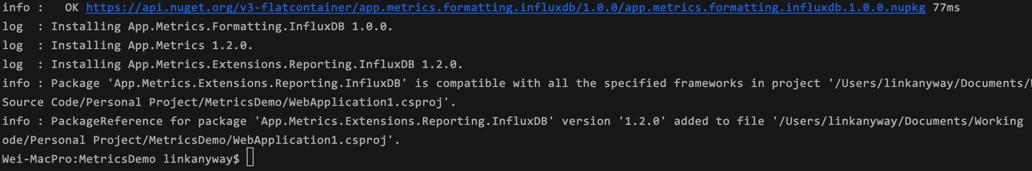
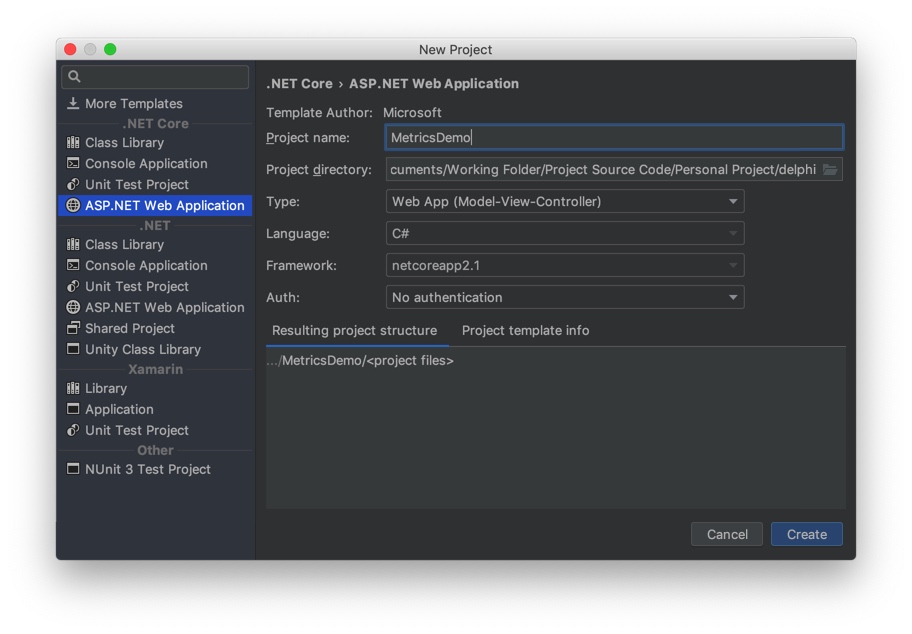
安装所需的第三方库
dotnet add package App.Metrics.Extensions.Mvcdotnet add package App.Metrics.FORMatters.JSONdotnet add package App.Metrics.Extensions.Reporting.InfluxDB控制台显示安装成功!

修改Startup.cs
using System;using System.Collections.Generic;using System.Linq;using System.Threading.Tasks;using App.Metrics.Configuration;using App.Metrics.Extensions.Reporting.InfluxDB;using App.Metrics.Extensions.Reporting.InfluxDB.Client;using App.Metrics.Reporting.Interfaces;using Microsoft.Aspnetcore.Builder;using Microsoft.AspNetCore.Hosting;using Microsoft.AspNetCore.Http;using Microsoft.AspNetCore.httpsPolicy;using Microsoft.AspNetCore.Mvc;using Microsoft.Extensions.Configuration;using Microsoft.Extensions.DependencyInjection;namespace WEBApplication1{ public class Startup { public Startup(IConfiguration configuration) { Configuration = configuration; } public IConfiguration Configuration { get; } public void ConfigureServices(IServiceCollection services) { #region 注册 App-Metrics & 配置输出report到influxdb var database = "MyMetrics"; var uri = new Uri(" http://127.0.0.1:8086 "); //本地Docker中运行的influx实例,注意InfluxDb有2个端口别搞错 services.AddMetrics(options => { options.WithGlobalTags((globalTags, info) => { globalTags.Add("app", info.EntryAssemblyName); globalTags.Add("env", "stage"); }); }) .AddHealthChecks() .AddReporting( factory => { factory.AddInfluxDb( new InfluxDBReporterSettings { InfluxDbSettings = new InfluxDBSettings(database, uri), ReportInterval = TimeSpan.FromSeconds(5) }); }) .AddMetricsMiddleware(options => options.IgnoredHttpStatusCodes = new[] {404}); #endregion services.Configure<CookiePolicyOptions>(options => { options.CheckConsentNeeded = context => true; options.MinimumSameSitePolicy = SameSiteMode.None; }); //添加Metric Filter到mvc services.AddMvc(options => options.AddMetricsResourceFilter()) .SetCompatibilityVersion(CompatibilityVersion.Version_2_1); } // This method gets called by the runtime. Use this method to configure the HTTP request pipeline. public void Configure(IApplicationBuilder app, IHostingEnvironment env, ILoggerFactory loggerFactory, IApplicationLifetime lifetime) { if (env.IsDevelopment()) { app.UseDeveloperExceptionPage(); } else { app.UseExceptionHandler("/Home/Error"); app.UseHsts(); } app.UseHttpsRedirection(); app.UseStaticFiles(); app.UseCookiePolicy(); loggerFactory.AddConsole(Configuration.GetSection(" Logging ")); app.UseMetrics(); app.UseMetricsReporting(lifetime); app.UseMvc(routes => { routes.MapRoute( name: "default", template: "{controller=Home}/{action=Index}/{id?}"); }); } }}接下来就是配置豪华的Grafana了!
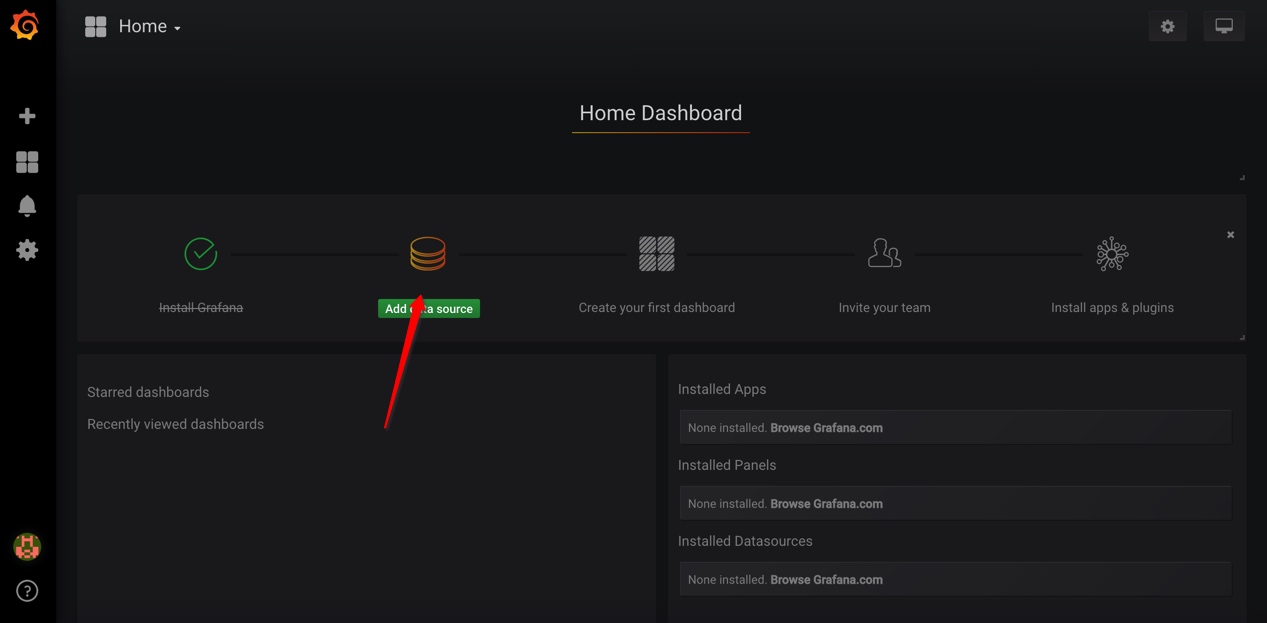
打开浏览器试着访问docker内运行的Grafana容器,默认的用户名和密码是admin/admin 不用担心,第一次登录成功后系统会要求你重新设置新的密码,很贴心!!
 

登录成功后,配置Datasource当然是选择我们之前运行的InfluxDb

按图进行配置
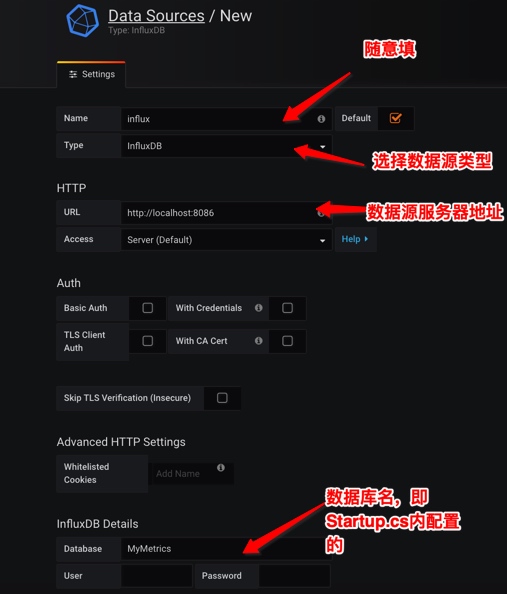 

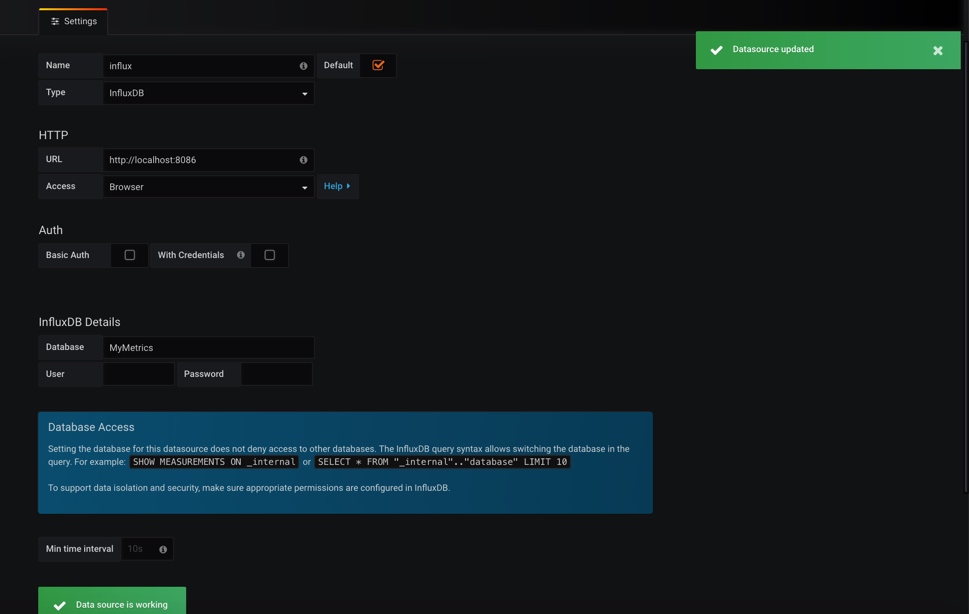
提交后,如下图显示即配置成功

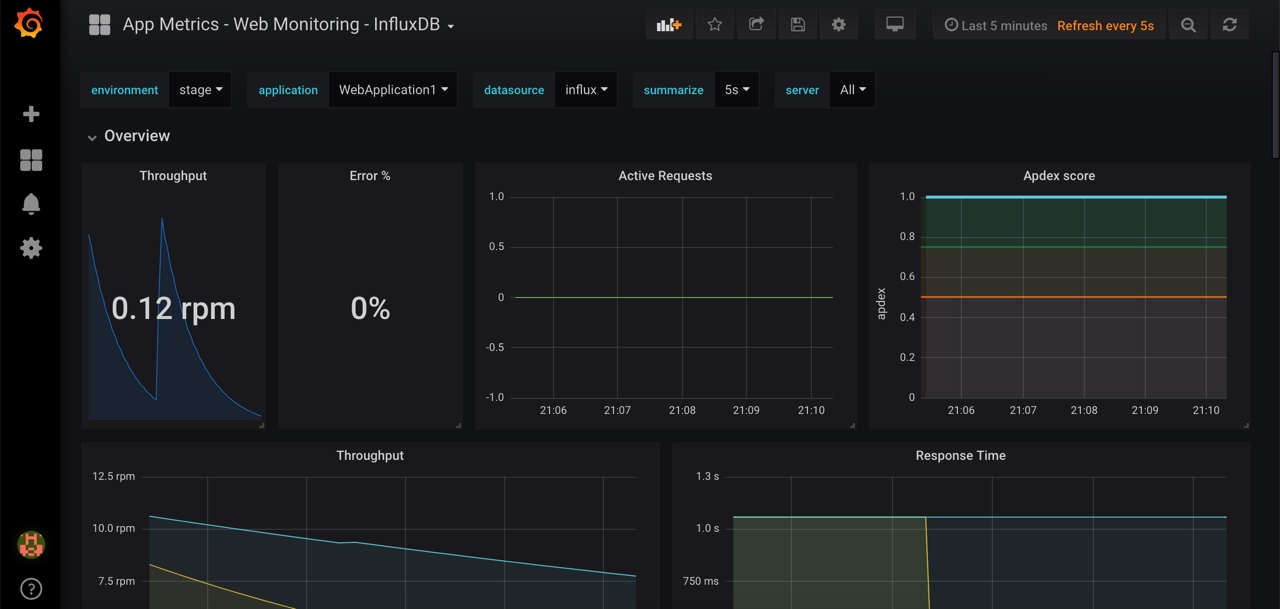
接着就是创建你的Dashboard,可以自己建立也可以自己配置json文件导入,网上有很多例子可以直接下载
{ "__inputs": [], "__requires": [ { "type": "grafana", "id": "grafana", "name": "Grafana", "version": "4.2.0" }, { "type": "panel", "id": "grafana-piechart-panel", "name": "Pie Chart", "version": "1.1.4" }, { "type": "panel", "id": "graph", "name": "Graph", "version": "" }, { "type": "panel", "id": "singlestat", "name": "Singlestat", "version": "" }, { "type": "panel", "id": "table", "name": "Table", "version": "" } ], "annotations": { "list": [] }, "description": "Dashboard to visualize metrics captured by App Metrics asp.net Core Middleware 1.2.0, tested with App.Metrics.Extensions.Reporting.InfluxDB 1.2.0 - http://app-metrics.io/", "editable": true, "gnetId": 2125, "graphTooltip": 1, "hideControls": false, "id": null, "links": [], "refresh": "5s", "rows": [ { "collapse": true, "height": "250", "panels": [ { "cacheTimeout": null, "colorBackground": false, "colorValue": false, "colors": [ "rgba(245, 54, 54, 0.9)", "rgba(237, 129, 40, 0.89)", "rgba(50, 172, 45, 0.97)" ], "datasource": "$datasource", "editable": true, "error": false, "format": "rpm", "gauge": { "maxValue": 100, "minValue": 0, "show": false, "thresholdLabels": false, "thresholdMarkers": true }, "id": 8, "interval": "", "links": [], "mappingType": 1, "mappingTypes": [ { "name": "value to text", "value": 1 }, { "name": "range to text", "value": 2 } ], "maxDataPoints": 100, "nullPointMode": "connected", "nullText": null, "postfix": "", "postfixFontSize": "50%", "prefix": "", "prefixFontSize": "50%", "rangeMaps": [ { "from": "null", "text": "N/A", "to": "null" } ], "span": 2, "sparkline": { "fillColor": "rgba(31, 118, 189, 0.18)", "full": true, "lineColor": "rgb(31, 120, 193)", "show": true }, "targets": [ { "dsType": "influxdb", "groupBy": [ { "params": [ "$interval" ], "type": "time" }, { "params": [ "null" ], "type": "fill" } ], "measurement": "application.httprequests__transactions", "policy": "default", "refId": "A", "resultFormat": "time_series", "select": [ [ { "params": [ "rate1m" ], "type": "field" }, { "params": [], "type": "last" } ] ], "tags": [ { "key": "app", "operator": "=~", "value": "/^$application$/" }, { "condition": "AND", "key": "env", "operator": "=~", "value": "/^$environment$/" }, { "condition": "AND", "key": "server", "operator": "=~", "value": "/^$server$/" } ] } ], "thresholds": "", "title": "Throughput", "type": "singlestat", "valueFontSize": "80%", "valueMaps": [ { "op": "=", "text": "N/A", "value": "null" } ], "valueName": "current" }, { "cacheTimeout": null, "colorBackground": false, "colorValue": false, "colors": [ "rgba(50, 172, 45, 0.97)", "rgba(237, 129, 40, 0.89)", "rgba(245, 54, 54, 0.9)" ], "datasource": "$datasource", "decimals": 4, "editable": true, "error": false, "format": "percent", "gauge": { "maxValue": 100, "minValue": 0, "show": false, "thresholdLabels": false, "thresholdMarkers": true }, "id": 6, "interval": null, "links": [], "mappingType": 1, "mappingTypes": [ { "name": "value to text", "value": 1 }, { "name": "range to text", "value": 2 } ], "maxDataPoints": 100, "nullPointMode": "connected", "nullText": null, "postfix": "", "postfixFontSize": "50%", "prefix": "", "prefixFontSize": "50%", "rangeMaps": [ { "from": "", "text": "", "to": "" } ], "span": 2, "sparkline": { "fillColor": "rgba(31, 118, 189, 0.18)", "full": true, "lineColor": "rgb(31, 120, 193)", "show": true }, "targets": [ { "dsType": "influxdb", "groupBy": [], "measurement": "application.httprequests__one_minute_error_percentage_rate", "policy": "default", "query": "SELECT \"value\" FROM \"application.httprequests__percentage_error_requests\" WHERE $timeFilter", "rawQuery": false, "refId": "A", "resultFormat": "time_series", "select": [ [ { "params": [ "value" ], "type": "field" } ] ], "tags": [ { "key": "env", "operator": "=~", "value": "/^$environment$/" }, { "condition": "AND", "key": "app", "operator": "=~", "value": "/^$application$/" }, { "condition": "AND", "key": "server", "operator": "=~", "value": "/^$server$/" } ] } ], "thresholds": "", "title": "Error %", "type": "singlestat", "valueFontSize": "80%", "valueMaps": [ { "op": "=", "text": "0%", "value": "null" } ], "valueName": "current" }, { "aliasColors": {}, "bars": false, "datasource": "$datasource", "editable": true, "error": false, "fill": 2, "id": 13, "interval": "$summarize", "legend": { "avg": false, "current": false, "max": false, "min": false, "show": false, "total": false, "values": false }, "lines": true, "linewidth": 1, "links": [], "nullPointMode": "connected", "percentage": false, "pointradius": 5, "points": false, "renderer": "flot", "seriesOverrides": [], "span": 4, "stack": false, "steppedLine": false, "targets": [ { "alias": "", "dsType": "influxdb", "groupBy": [ { "params": [ "$interval" ], "type": "time" }, { "params": [ "null" ], "type": "fill" } ], "measurement": "application.httprequests__active", "policy": "default", "refId": "A", "resultFormat": "time_series", "select": [ [ { "params": [ "value" ], "type": "field" }, { "params": [], "type": "last" } ] ], "tags": [ { "key": "env", "operator": "=~", "value": "/^$environment$/" }, { "condition": "AND", "key": "app", "operator": "=~", "value": "/^$application$/" }, { "condition": "AND", "key": "server", "operator": "=~", "value": "/^$server$/" } ] } ], "thresholds": [], "timeFrom": null, "timeShift": null, "title": "Active Requests", "tooltip": { "msResolution": false, "shared": true, "sort": 0, "value_type": "individual" }, "type": "graph", "xaxis": { "mode": "time", "name": null, "show": true, "values": [] }, "yaxes": [ { "format": "short", "label": null, "logBase": 1, "max": null, "min": null, "show": true }, { "format": "short", "label": null, "logBase": 1, "max": null, "min": null, "show": true } ] }, { "aliasColors": { "application.httprequests__apdex.last": "#6ED0E0" }, "bars": false, "datasource": "$datasource", "editable": true, "error": false, "fill": 1, "height": "", "id": 7, "interval": "$summarize", "legend": { "avg": false, "current": false, "max": false, "min": false, "show": false, "total": false, "values": false }, "lines": true, "linewidth": 3, "links": [], "nullPointMode": "connected", "percentage": false, "pointradius": 5, "points": false, "renderer": "flot", "seriesOverrides": [], "span": 4, "stack": false, "steppedLine": false, "targets": [ { "dsType": "influxdb", "groupBy": [ { "params": [ "$interval" ], "type": "time" }, { "params": [ "null" ], "type": "fill" } ], "measurement": "application.httprequests__apdex", "policy": "default", "refId": "A", "resultFormat": "time_series", "select": [ [ { "params": [ "score" ], "type": "field" }, { "params": [], "type": "last" } ] ], "tags": [ { "key": "app", "operator": "=~", "value": "/^$application$/" }, { "condition": "AND", "key": "env", "operator": "=~", "value": "/^$environment$/" }, { "condition": "AND", "key": "server", "operator": "=~", "value": "/^$server$/" } ] } ], "thresholds": [ { "colorMode": "critical", "fill": true, "line": true, "op": "lt", "value": 0.5 }, { "colorMode": "warning", "fill": true, "line": true, "op": "gt", "value": 0.5 }, { "colorMode": "ok", "fill": true, "line": true, "op": "gt", "value": 0.75 } ], "timeFrom": null, "timeShift": null, "title": "Apdex score", "tooltip": { "msResolution": false, "shared": true, "sort": 0, "value_type": "individual" }, "type": "graph", "xaxis": { "mode": "time", "name": null, "show": true, "values": [] }, "yaxes": [ { "format": "short", "label": "apdex", "logBase": 1, "max": "1", "min": "0", "show": true }, { "format": "short", "label": null, "logBase": 1, "max": null, "min": null, "show": false } ] }, { "aliasColors": {}, "bars": false, "datasource": "$datasource", "editable": true, "error": false, "fill": 1, "height": "350", "id": 1, "interval": "$summarize", "legend": { "avg": false, "current": true, "max": false, "min": false, "show": true, "total": false, "values": true }, "lines": true, "linewidth": 1, "links": [], "nullPointMode": "connected", "percentage": false, "pointradius": 5, "points": false, "renderer": "flot", "seriesOverrides": [], "span": 6, "stack": false, "steppedLine": false, "targets": [ { "alias": "$col", "dsType": "influxdb", "groupBy": [ { "params": [ "$interval" ], "type": "time" }, { "params": [ "null" ], "type": "fill" } ], "measurement": "application.httprequests__transactions", "policy": "default", "refId": "A", "resultFormat": "time_series", "select": [ [ { "params": [ "rate1m" ], "type": "field" }, { "params": [], "type": "last" }, { "params": [ "1 min rate" ], "type": "alias" } ], [ { "params": [ "rate5m" ], "type": "field" }, { "params": [], "type": "last" }, { "params": [ "5 min rate" ], "type": "alias" } ], [ { "params": [ "rate15m" ], "type": "field" }, { "params": [], "type": "last" }, { "params": [ "15 min rate" ], "type": "alias" } ] ], "tags": [ { "key": "env", "operator": "=~", "value": "/^$environment$/" }, { "condition": "AND", "key": "app", "operator": "=~", "value": "/^$application$/" }, { "condition": "AND", "key": "server", "operator": "=~", "value": "/^$server$/" } ] } ], "thresholds": [], "timeFrom": null, "timeShift": null, "title": "Throughput", "tooltip": { "msResolution": false, "shared": true, "sort": 0, "value_type": "individual" }, "type": "graph", "xaxis": { "mode": "time", "name": null, "show": true, "values": [] }, "yaxes": [ { "format": "rpm", "label": null, "logBase": 1, "max": null, "min": null, "show": true }, { "format": "short", "label": null, "logBase": 1, "max": null, "min": null, "show": true } ] }, { "aliasColors": {}, "bars": false, "datasource": "$datasource", "editable": true, "error": false, "fill": 1, "height": "350", "id": 2, "interval": "$summarize", "legend": { "alignAsTable": false, "avg": false, "current": false, "max": false, "min": false, "rightSide": false, "show": true, "total": false, "values": false }, "lines": true, "linewidth": 1, "links": [], "nullPointMode": "connected", "percentage": false, "pointradius": 5, "points": false, "renderer": "flot", "seriesOverrides": [], "span": 6, "stack": false, "steppedLine": false, "targets": [ { "alias": "$col", "dsType": "influxdb", "groupBy": [ { "params": [ "$interval" ], "type": "time" }, { "params": [ "null" ], "type": "fill" } ], "measurement": "application.httprequests__transactions", "policy": "default", "refId": "A", "resultFormat": "time_series", "select": [ [ { "params": [ "p95" ], "type": "field" }, { "params": [], "type": "last" }, { "params": [ "95th Percentile" ], "type": "alias" } ], [ { "params": [ "p98" ], "type": "field" }, { "params": [], "type": "last" }, { "params": [ "98th Percentile" ], "type": "alias" } ], [ { "params": [ "p99" ], "type": "field" }, { "params": [], "type": "last" }, { "params": [ "99th Percentile" ], "type": "alias" } ] ], "tags": [ { "key": "env", "operator": "=~", "value": "/^$environment$/" }, { "condition": "AND", "key": "app", "operator": "=~", "value": "/^$application$/" }, { "condition": "AND", "key": "server", "operator": "=~", "value": "/^$server$/" } ] } ], "thresholds": [], "timeFrom": null, "timeShift": null, "title": "Response Time", "tooltip": { "msResolution": false, "shared": true, "sort": 0, "value_type": "individual" }, "type": "graph", "xaxis": { "mode": "time", "name": null, "show": true, "values": [] }, "yaxes": [ { "format": "ms", "label": null, "logBase": 1, "max": null, "min": null, "show": true }, { "format": "short", "label": null, "logBase": 1, "max": null, "min": null, "show": true } ] }, { "aliasColors": {}, "bars": false, "datasource": "$datasource", "editable": true, "error": false, "fill": 1, "height": "", "id": 9, "interval": "$summarize", "legend": { "alignAsTable": true, "avg": false, "current": true, "max": false, "min": false, "rightSide": true, "show": false, "total": false, "values": true }, "lines": true, "linewidth": 1, "links": [], "nullPointMode": "connected", "percentage": false, "pointradius": 5, "points": false, "renderer": "flot", "seriesOverrides": [], "span": 6, "stack": false, "steppedLine": false, "targets": [ { "alias": "", "dsType": "influxdb", "groupBy": [ { "params": [ "$interval" ], "type": "time" }, { "params": [ "null" ], "type": "fill" } ], "measurement": "application.httprequests__one_minute_error_percentage_rate", "policy": "default", "refId": "A", "resultFormat": "time_series", "select": [ [ { "params": [ "value" ], "type": "field" }, { "params": [], "type": "last" } ] ], "tags": [ { "key": "app", "operator": "=~", "value": "/^$application$/" }, { "condition": "AND", "key": "env", "operator": "=~", "value": "/^$environment$/" }, { "condition": "AND", "key": "server", "operator": "=~", "value": "/^$server$/" } ] } ], "thresholds": [], "timeFrom": null, "timeShift": null, "title": "Error Rate %", "tooltip": { "msResolution": false, "shared": true, "sort": 0, "value_type": "individual" }, "type": "graph", "xaxis": { "mode": "time", "name": null, "show": true, "values": [] }, "yaxes": [ { "format": "percent", "label": null, "logBase": 1, "max": "100", "min": "0", "show": true }, { "format": "short", "label": null, "logBase": 1, "max": null, "min": null, "show": true } ] }, { "aliasColors": {}, "bars": false, "datasource": "$datasource", "decimals": 2, "editable": true, "error": false, "fill": 1, "height": "250px", "id": 3, "interval": "$summarize", "legend": { "alignAsTable": true, "avg": false, "current": true, "max": false, "min": false, "rightSide": true, "show": true, "total": false, "values": true }, "lines": true, "linewidth": 1, "links": [], "nullPointMode": "connected", "percentage": false, "pointradius": 5, "points": false, "renderer": "flot", "seriesOverrides": [], "span": 6, "stack": false, "steppedLine": false, "targets": [ { "alias": "$col", "dsType": "influxdb", "groupBy": [ { "params": [ "$interval" ], "type": "time" }, { "params": [ "null" ], "type": "fill" } ], "measurement": "application.httprequests__error_rate", "policy": "default", "refId": "A", "resultFormat": "time_series", "select": [ [ { "params": [ "rate1m" ], "type": "field" }, { "params": [], "type": "last" }, { "params": [ "1min rate" ], "type": "alias" } ], [ { "params": [ "rate5m" ], "type": "field" }, { "params": [], "type": "last" }, { "params": [ "5min rate" ], "type": "alias" } ], [ { "params": [ "rate15m" ], "type": "field" }, { "params": [], "type": "last" }, { "params": [ "15min rate" ], "type": "alias" } ] ], "tags": [ { "key": "app", "operator": "=~", "value": "/^$application$/" }, { "condition": "AND", "key": "env", "operator": "=~", "value": "/^$environment$/" }, { "condition": "AND", "key": "server", "operator": "=~", "value": "/^$server$/" } ] } ], "thresholds": [], "timeFrom": null, "timeShift": null, "title": "Error Rate", "tooltip": { "msResolution": false, "shared": true, "sort": 2, "value_type": "individual" }, "type": "graph", "xaxis": { "mode": "time", "name": null, "show": true, "values": [] }, "yaxes": [ { "format": "rpm", "label": null, "logBase": 1, "max": null, "min": null, "show": true }, { "format": "short", "label": null, "logBase": 1, "max": null, "min": null, "show": true } ] }, { "aliasColors": {}, "cacheTimeout": null, "combine": { "label": "Others", "threshold": 0 }, "datasource": "$datasource", "editable": true, "error": false, "fontSize": "80%", "format": "percent", "height": "250px", "id": 4, "interval": "", "legend": { "percentage": true, "show": true, "sort": null, "sortDesc": null, "values": true }, "legendType": "Right side", "links": [], "maxDataPoints": 3, "nullPointMode": "connected", "pieType": "pie", "span": 5, "strokeWidth": 1, "targets": [ { "alias": "$tag_http_status_code", "dsType": "influxdb", "groupBy": [ { "params": [ "http_status_code" ], "type": "tag" } ], "measurement": "application.httprequests__errors", "policy": "default", "refId": "A", "resultFormat": "time_series", "select": [ [ { "params": [ "value" ], "type": "field" }, { "params": [], "type": "sum" } ] ], "tags": [ { "key": "app", "operator": "=~", "value": "/^$application$/" }, { "condition": "AND", "key": "env", "operator": "=~", "value": "/^$environment$/" }, { "condition": "AND", "key": "server", "operator": "=~", "value": "/^$server$/" } ] } ], "title": "Errors", "type": "grafana-piechart-panel", "valueName": "current" }, { "columns": [ { "text": "Total", "value": "total" } ], "datasource": "$datasource", "editable": true, "error": false, "filterNull": true, "fontSize": "100%", "id": 24, "interval": "", "links": [], "pageSize": 20, "scroll": true, "showHeader": true, "sort": { "col": 1, "desc": true }, "span": 7, "styles": [ { "dateFormat": "YYYY-MM-DD HH:mm:ss", "pattern": "Time", "type": "date" }, { "colorMode": null, "colors": [ "rgba(245, 54, 54, 0.9)", "rgba(237, 129, 40, 0.89)", "rgba(50, 172, 45, 0.97)" ], "decimals": 0, "pattern": "/.*/", "thresholds": [], "type": "number", "unit": "none" } ], "targets": [ { "alias": "$tag_exception", "dsType": "influxdb", "groupBy": [ { "params": [ "$interval" ], "type": "time" }, { "params": [ "exception" ], "type": "tag" } ], "measurement": "application.httprequests__exceptions", "policy": "default", "refId": "A", "resultFormat": "time_series", "select": [ [ { "params": [ "value" ], "type": "field" }, { "params": [], "type": "last" } ] ], "tags": [ { "key": "env", "operator": "=~", "value": "/^$environment$/" }, { "condition": "AND", "key": "app", "operator": "=~", "value": "/^$application$/" }, { "condition": "AND", "key": "server", "operator": "=~", "value": "/^$server$/" } ] } ], "title": "Uncaught Exceptions Thrown", "transform": "timeseries_aggregations", "type": "table" } ], "repeat": null, "repeatIteration": null, "repeatRowId": null, "showTitle": true, "title": "Overview", "titleSize": "h7" }, { "collapse": false, "height": "300", "panels": [ { "aliasColors": {}, "bars": false, "datasource": "$datasource", "editable": true, "error": false, "fill": 1, "height": "350", "id": 16, "interval": "$summarize", "legend": { "alignAsTable": true, "avg": false, "current": false, "max": false, "min": false, "rightSide": true, "show": true, "sort": "current", "sortDesc": true, "total": false, "values": false }, "lines": true, "linewidth": 1, "links": [], "nullPointMode": "connected", "percentage": false, "pointradius": 5, "points": false, "renderer": "flot", "seriesOverrides": [], "span": 6, "stack": true, "steppedLine": false, "targets": [ { "alias": "$tag_route", "dsType": "influxdb", "groupBy": [ { "params": [ "$interval" ], "type": "time" }, { "params": [ "route" ], "type": "tag" }, { "params": [ "null" ], "type": "fill" } ], "measurement": "application.httprequests__transactions_per_endpoint", "policy": "default", "refId": "A", "resultFormat": "time_series", "select": [ [ { "params": [ "rate1m" ], "type": "field" }, { "params": [], "type": "last" } ] ], "tags": [ { "key": "env", "operator": "=~", "value": "/^$environment$/" }, { "condition": "AND", "key": "app", "operator": "=~", "value": "/^$application$/" }, { "condition": "AND", "key": "server", "operator": "=~", "value": "/^$server$/" } ] } ], "thresholds": [], "timeFrom": null, "timeShift": null, "title": "Throughput / Endpoint", "tooltip": { "msResolution": false, "shared": true, "sort": 2, "value_type": "individual" }, "transparent": false, "type": "graph", "xaxis": { "mode": "time", "name": null, "show": true, "values": [] }, "yaxes": [ { "format": "rpm", "label": null, "logBase": 1, "max": null, "min": null, "show": true }, { "format": "short", "label": null, "logBase": 1, "max": null, "min": null, "show": true } ] }, { "aliasColors": {}, "bars": false, "datasource": "$datasource", "editable": true, "error": false, "fill": 1, "height": "350", "id": 17, "interval": "$summarize", "legend": { "alignAsTable": true, "avg": false, "current": false, "max": false, "min": false, "rightSide": true, "show": true, "total": false, "values": false }, "lines": true, "linewidth": 1, "links": [], "nullPointMode": "connected", "percentage": false, "pointradius": 5, "points": false, "renderer": "flot", "seriesOverrides": [], "span": 6, "stack": false, "steppedLine": false, "targets": [ { "alias": "$tag_route", "dsType": "influxdb", "groupBy": [ { "params": [ "$interval" ], "type": "time" }, { "params": [ "route" ], "type": "tag" }, { "params": [ "null" ], "type": "fill" } ], "measurement": "application.httprequests__transactions_per_endpoint", "policy": "default", "refId": "A", "resultFormat": "time_series", "select": [ [ { "params": [ "p95" ], "type": "field" }, { "params": [], "type": "last" }, { "params": [ "95th Percentile" ], "type": "alias" } ] ], "tags": [ { "key": "env", "operator": "=~", "value": "/^$environment$/" }, { "condition": "AND", "key": "app", "operator": "=~", "value": "/^$application$/" }, { "condition": "AND", "key": "server", "operator": "=~", "value": "/^$server$/" } ] } ], "thresholds": [], "timeFrom": null, "timeShift": null, "title": "Response Time / Endpoint", "tooltip": { "msResolution": false, "shared": true, "sort": 0, "value_type": "individual" }, "type": "graph", "xaxis": { "mode": "time", "name": null, "show": true, "values": [] }, "yaxes": [ { "format": "ms", "label": null, "logBase": 1, "max": null, "min": null, "show": true }, { "format": "short", "label": null, "logBase": 1, "max": null, "min": null, "show": true } ] }, { "columns": [ { "text": "Current", "value": "current" } ], "datasource": "$datasource", "editable": true, "error": false, "filterNull": false, "fontSize": "100%", "id": 10, "interval": "", "links": [], "pageSize": null, "scroll": true, "showHeader": true, "sort": { "col": 1, "desc": true }, "span": 6, "styles": [ { "dateFormat": "YYYY-MM-DD HH:mm:ss", "pattern": "Time", "type": "date" }, { "colorMode": null, "colors": [ "rgba(245, 54, 54, 0.9)", "rgba(237, 129, 40, 0.89)", "rgba(50, 172, 45, 0.97)" ], "decimals": 2, "pattern": "/.*/", "thresholds": [], "type": "number", "unit": "ms" } ], "targets": [ { "alias": "$tag_route", "dsType": "influxdb", "groupBy": [ { "params": [ "$interval" ], "type": "time" }, { "params": [ "route" ], "type": "tag" }, { "params": [ "null" ], "type": "fill" } ], "measurement": "application.httprequests__transactions_per_endpoint", "policy": "default", "refId": "A", "resultFormat": "time_series", "select": [ [ { "params": [ "p95" ], "type": "field" }, { "params": [], "type": "last" } ] ], "tags": [ { "key": "env", "operator": "=~", "value": "/^$environment$/" }, { "condition": "AND", "key": "app", "operator": "=~", "value": "/^$application$/" }, { "condition": "AND", "key": "server", "operator": "=~", "value": "/^$server$/" } ] } ], "title": "Response Times / Endpoint", "transform": "timeseries_aggregations", "type": "table" }, { "columns": [ { "text": "Current", "value": "current" } ], "datasource": "$datasource", "editable": true, "error": false, "filterNull": false, "fontSize": "100%", "id": 12, "interval": "", "links": [], "pageSize": null, "scroll": true, "showHeader": true, "sort": { "col": 1, "desc": true }, "span": 6, "styles": [ { "dateFormat": "YYYY-MM-DD HH:mm:ss", "pattern": "Time", "type": "date" }, { "colorMode": null, "colors": [ "rgba(245, 54, 54, 0.9)", "rgba(237, 129, 40, 0.89)", "rgba(50, 172, 45, 0.97)" ], "decimals": 2, "pattern": "/.*/", "thresholds": [], "type": "number", "unit": "rpm" } ], "targets": [ { "alias": "$tag_route", "dsType": "influxdb", "groupBy": [ { "params": [ "$interval" ], "type": "time" }, { "params": [ "route" ], "type": "tag" }, { "params": [ "null" ], "type": "fill" } ], "measurement": "application.httprequests__transactions_per_endpoint", "policy": "default", "refId": "A", "resultFormat": "time_series", "select": [ [ { "params": [ "rate1m" ], "type": "field" }, { "params": [], "type": "last" } ] ], "tags": [ { "key": "env", "operator": "=~", "value": "/^$environment$/" }, { "condition": "AND", "key": "app", "operator": "=~", "value": "/^$application$/" }, { "condition": "AND", "key": "server", "operator": "=~", "value": "/^$server$/" } ] } ], "title": "Throughput / Endpoint", "transform": "timeseries_aggregations", "type": "table" }, { "columns": [ { "text": "Current", "value": "current" } ], "datasource": "$datasource", "editable": true, "error": false, "filterNull": false, "fontSize": "100%", "id": 11, "interval": "", "links": [], "pageSize": null, "scroll": true, "showHeader": true, "sort": { "col": null, "desc": false }, "span": 6, "styles": [ { "dateFormat": "YYYY-MM-DD HH:mm:ss", "pattern": "Time", "type": "date" }, { "colorMode": null, "colors": [ "rgba(245, 54, 54, 0.9)", "rgba(237, 129, 40, 0.89)", "rgba(50, 172, 45, 0.97)" ], "decimals": 0, "pattern": "/.*/", "thresholds": [], "type": "number", "unit": "percent" } ], "targets": [ { "alias": "$tag_route", "dsType": "influxdb", "groupBy": [ { "params": [ "$interval" ], "type": "time" }, { "params": [ "route" ], "type": "tag" }, { "params": [ "null" ], "type": "fill" } ], "measurement": "application.httprequests__one_minute_error_percentage_rate_per_endpoint", "policy": "default", "refId": "A", "resultFormat": "time_series", "select": [ [ { "params": [ "value" ], "type": "field" }, { "params": [], "type": "last" } ] ], "tags": [ { "key": "app", "operator": "=~", "value": "/^$application$/" }, { "condition": "AND", "key": "env", "operator": "=~", "value": "/^$environment$/" }, { "condition": "AND", "key": "server", "operator": "=~", "value": "/^$server$/" } ] } ], "title": "Error Request Percentage / Endpoint", "transform": "timeseries_aggregations", "type": "table" }, { "columns": [ { "text": "Total", "value": "total" } ], "datasource": "$datasource", "editable": true, "error": false, "filterNull": false, "fontSize": "100%", "id": 25, "interval": "", "links": [], "pageSize": null, "scroll": true, "showHeader": true, "sort": { "col": 1, "desc": true }, "span": 6, "styles": [ { "dateFormat": "YYYY-MM-DD HH:mm:ss", "pattern": "Time", "type": "date" }, { "colorMode": null, "colors": [ "rgba(245, 54, 54, 0.9)", "rgba(237, 129, 40, 0.89)", "rgba(50, 172, 45, 0.97)" ], "decimals": 0, "pattern": "/.*/", "thresholds": [], "type": "number", "unit": "none" } ], "targets": [ { "alias": "$tag_route [$tag_exception]", "dsType": "influxdb", "groupBy": [ { "params": [ "$interval" ], "type": "time" }, { "params": [ "route" ], "type": "tag" }, { "params": [ "exception" ], "type": "tag" } ], "measurement": "application.httprequests__exceptions", "policy": "default", "refId": "A", "resultFormat": "time_series", "select": [ [ { "params": [ "value" ], "type": "field" }, { "params": [], "type": "last" } ] ], "tags": [ { "key": "env", "operator": "=~", "value": "/^$environment$/" }, { "condition": "AND", "key": "app", "operator": "=~", "value": "/^$application$/" }, { "condition": "AND", "key": "server", "operator": "=~", "value": "/^$server$/" } ] } ], "title": "Uncaught Exceptions Thrown / Endpoint", "transform": "timeseries_aggregations", "type": "table" } ], "repeat": null, "repeatIteration": null, "repeatRowId": null, "showTitle": true, "title": "Endpoints", "titleSize": "h7" }, { "collapse": false, "height": "250", "panels": [ { "columns": [ { "text": "Current", "value": "current" } ], "datasource": "$datasource", "editable": true, "error": false, "filterNull": false, "fontSize": "100%", "hideTimeOverride": true, "id": 22, "interval": "", "links": [], "pageSize": null, "scroll": true, "showHeader": true, "sort": { "col": 0, "desc": true }, "span": 9, "styles": [ { "dateFormat": "YYYY-MM-DD HH:mm:ss", "pattern": "Time", "type": "date" }, { "colorMode": "row", "colors": [ "rgba(245, 54, 54, 0.9)", "rgba(237, 129, 40, 0.89)", "rgba(50, 172, 45, 0.97)" ], "decimals": 1, "pattern": "/.*/", "thresholds": [ "0.5", "1" ], "type": "number", "unit": "short" } ], "targets": [ { "alias": "$tag_health_check_name", "dsType": "influxdb", "groupBy": [ { "params": [ "$interval" ], "type": "time" }, { "params": [ "health_check_name" ], "type": "tag" }, { "params": [ "null" ], "type": "fill" } ], "measurement": "application.health__results", "policy": "default", "refId": "A", "resultFormat": "time_series", "select": [ [ { "params": [ "value" ], "type": "field" }, { "params": [], "type": "last" } ] ], "tags": [ { "key": "env", "operator": "=~", "value": "/^$environment$/" }, { "condition": "AND", "key": "app", "operator": "=~", "value": "/^$application$/" }, { "condition": "AND", "key": "server", "operator": "=~", "value": "/^$server$/" } ] } ], "timeFrom": null, "title": "Results", "transform": "timeseries_aggregations", "transparent": true, "type": "table" }, { "cacheTimeout": null, "colorBackground": true, "colorValue": false, "colors": [ "rgba(245, 54, 54, 0.9)", "rgba(237, 129, 40, 0.89)", "rgba(50, 172, 45, 0.97)" ], "datasource": "$datasource", "editable": true, "error": false, "format": "none", "gauge": { "maxValue": 100, "minValue": 0, "show": false, "thresholdLabels": false, "thresholdMarkers": true }, "hideTimeOverride": true, "id": 19, "interval": null, "links": [ { "type": "dashboard" } ], "mappingType": 2, "mappingTypes": [ { "name": "value to text", "value": 1 }, { "name": "range to text", "value": 2 } ], "maxDataPoints": 100, "nullPointMode": "connected", "nullText": null, "postfix": "", "postfixFontSize": "50%", "prefix": "", "prefixFontSize": "50%", "rangeMaps": [ { "from": "0", "text": "Unhealthy", "to": "0.49" }, { "from": "0.5", "text": "Degraded", "to": "0.9" }, { "from": "1.0", "text": "Healthy", "to": "2.0" } ], "span": 3, "sparkline": { "fillColor": "rgba(31, 118, 189, 0.18)", "full": false, "lineColor": "rgb(31, 120, 193)", "show": false }, "targets": [ { "dsType": "influxdb", "groupBy": [ { "params": [ "$interval" ], "type": "time" }, { "params": [ "null" ], "type": "fill" } ], "measurement": "application.health__score", "policy": "default", "refId": "A", "resultFormat": "time_series", "select": [ [ { "params": [ "value" ], "type": "field" }, { "params": [], "type": "last" } ] ], "tags": [ { "key": "env", "operator": "=~", "value": "/^$environment$/" }, { "condition": "AND", "key": "app", "operator": "=~", "value": "/^$application$/" }, { "condition": "AND", "key": "server", "operator": "=~", "value": "/^$server$/" } ] } ], "thresholds": "0.5,1", "timeFrom": null, "title": "", "transparent": true, "type": "singlestat", "valueFontSize": "80%", "valueMaps": [ { "op": "=", "text": "Unhealthy", "value": "0" }, { "op": "=", "text": "Degraded", "value": "0.5" }, { "op": "=", "text": "Healthy", "value": "1.0" } ], "valueName": "current" } ], "repeat": null, "repeatIteration": null, "repeatRowId": null, "showTitle": true, "title": "Health", "titleSize": "h7" }, { "collapse": false, "height": "300", "panels": [ { "aliasColors": {}, "bars": false, "datasource": "$datasource", "editable": true, "error": false, "fill": 1, "id": 14, "interval": "$summarize", "legend": { "alignAsTable": true, "avg": false, "current": true, "hideEmpty": false, "max": false, "min": false, "rightSide": true, "show": true, "total": false, "values": true }, "lines": true, "linewidth": 1, "links": [], "nullPointMode": "connected", "percentage": false, "pointradius": 5, "points": false, "renderer": "flot", "seriesOverrides": [], "span": 6, "stack": false, "steppedLine": false, "targets": [ { "alias": "$col", "dsType": "influxdb", "groupBy": [ { "params": [ "$interval" ], "type": "time" }, { "params": [ "null" ], "type": "fill" } ], "measurement": "application.httprequests__post_size", "policy": "default", "refId": "A", "resultFormat": "time_series", "select": [ [ { "params": [ "p95" ], "type": "field" }, { "params": [], "type": "last" }, { "params": [ "95th percentile" ], "type": "alias" } ], [ { "params": [ "p98" ], "type": "field" }, { "params": [], "type": "last" }, { "params": [ "98th percentile" ], "type": "alias" } ], [ { "params": [ "p99" ], "type": "field" }, { "params": [], "type": "last" }, { "params": [ "99th percentile" ], "type": "alias" } ], [ { "params": [ "last" ], "type": "field" }, { "params": [], "type": "median" }, { "params": [ "median" ], "type": "alias" } ] ], "tags": [ { "key": "app", "operator": "=~", "value": "/^$application$/" }, { "condition": "AND", "key": "env", "operator": "=~", "value": "/^$environment$/" }, { "condition": "AND", "key": "server", "operator": "=~", "value": "/^$server$/" } ] } ], "thresholds": [], "timeFrom": null, "timeShift": null, "title": "Post Request Size", "tooltip": { "msResolution": false, "shared": true, "sort": 0, "value_type": "individual" }, "type": "graph", "xaxis": { "mode": "time", "name": null, "show": true, "values": [] }, "yaxes": [ { "format": "decbytes", "label": null, "logBase": 1, "max": null, "min": null, "show": true }, { "format": "short", "label": null, "logBase": 1, "max": null, "min": null, "show": true } ] }, { "aliasColors": {}, "bars": false, "datasource": "$datasource", "editable": true, "error": false, "fill": 1, "id": 15, "interval": "$summarize", "legend": { "alignAsTable": true, "avg": false, "current": true, "max": false, "min": false, "rightSide": true, "show": true, "total": false, "values": true }, "lines": true, "linewidth": 1, "links": [], "nullPointMode": "connected", "percentage": false, "pointradius": 5, "points": false, "renderer": "flot", "seriesOverrides": [], "span": 6, "stack": false, "steppedLine": false, "targets": [ { "alias": "$col", "dsType": "influxdb", "groupBy": [ { "params": [ "$interval" ], "type": "time" }, { "params": [ "null" ], "type": "fill" } ], "measurement": "application.httprequests__put_size", "policy": "default", "refId": "A", "resultFormat": "time_series", "select": [ [ { "params": [ "p95" ], "type": "field" }, { "params": [], "type": "last" }, { "params": [ "95th percentile" ], "type": "alias" } ], [ { "params": [ "p98" ], "type": "field" }, { "params": [], "type": "last" }, { "params": [ "98th percentile" ], "type": "alias" } ], [ { "params": [ "p99" ], "type": "field" }, { "params": [], "type": "last" }, { "params": [ "99th percentile" ], "type": "alias" } ], [ { "params": [ "median" ], "type": "field" }, { "params": [], "type": "median" }, { "params": [ "median" ], "type": "alias" } ] ], "tags": [ { "key": "app", "operator": "=~", "value": "/^$application$/" }, { "condition": "AND", "key": "env", "operator": "=~", "value": "/^$environment$/" }, { "condition": "AND", "key": "server", "operator": "=~", "value": "/^$server$/" } ] } ], "thresholds": [], "timeFrom": null, "timeShift": null, "title": "Put Request Size", "tooltip": { "msResolution": false, "shared": true, "sort": 0, "value_type": "individual" }, "type": "graph", "xaxis": { "mode": "time", "name": null, "show": true, "values": [] }, "yaxes": [ { "format": "bytes", "label": null, "logBase": 1, "max": null, "min": null, "show": true }, { "format": "short", "label": null, "logBase": 1, "max": null, "min": null, "show": true } ] } ], "repeat": null, "repeatIteration": null, "repeatRowId": null, "showTitle": true, "title": "PUT & POST Request Size", "titleSize": "h7" } ], "schemaVersion": 14, "style": "dark", "tags": [ "influxdb" ], "templating": { "list": [ { "allValue": null, "current": {}, "datasource": "$datasource", "hide": 0, "includeAll": false, "label": null, "multi": false, "name": "environment", "options": [], "query": "SHOW TAG VALUES WITH KEY = \"env\"", "refresh": 1, "regex": "", "sort": 1, "tagValuesQuery": null, "tags": [], "tagsQuery": null, "type": "query", "useTags": false }, { "allValue": null, "current": {}, "datasource": "$datasource", "hide": 0, "includeAll": false, "label": null, "multi": false, "name": "application", "options": [], "query": "SHOW TAG VALUES WITH KEY = \"app\"", "refresh": 1, "regex": "", "sort": 1, "tagValuesQuery": null, "tags": [], "tagsQuery": null, "type": "query", "useTags": false }, { "current": { "text": "AppMetriCSSandbox", "value": "AppMetricsSandbox" }, "hide": 0, "label": null, "name": "datasource", "options": [], "query": "influxdb", "refresh": 1, "regex": "", "type": "datasource" }, { "auto": false, "auto_count": 30, "auto_min": "10s", "current": { "text": "5s", "value": "5s" }, "hide": 0, "label": null, "name": "summarize", "options": [ { "selected": true, "text": "5s", "value": "5s" }, { "selected": false, "text": "10s", "value": "10s" }, { "selected": false, "text": "30s", "value": "30s" }, { "selected": false, "text": "1m", "value": "1m" }, { "selected": false, "text": "10m", "value": "10m" }, { "selected": false, "text": "30m", "value": "30m" }, { "selected": false, "text": "1h", "value": "1h" }, { "selected": false, "text": "6h", "value": "6h" }, { "selected": false, "text": "12h", "value": "12h" }, { "selected": false, "text": "1d", "value": "1d" }, { "selected": false, "text": "7d", "value": "7d" }, { "selected": false, "text": "14d", "value": "14d" }, { "selected": false, "text": "30d", "value": "30d" } ], "query": "5s,10s,30s,1m,10m,30m,1h,6h,12h,1d,7d,14d,30d", "refresh": 2, "type": "interval" }, { "allValue": null, "current": {}, "datasource": "$datasource", "hide": 0, "includeAll": true, "label": null, "multi": true, "name": "server", "options": [], "query": "SHOW TAG VALUES WITH KEY = \"server\"", "refresh": 1, "regex": "", "sort": 0, "tagValuesQuery": "", "tags": [], "tagsQuery": "", "type": "query", "useTags": false } ] }, "time": { "from": "now-5m", "to": "now" }, "timepicker": { "refresh_intervals": [ "5s", "10s", "30s", "1m", "5m", "15m", "30m", "1h", "2h", "1d" ], "time_options": [ "5m", "15m", "1h", "6h", "12h", "24h", "2d", "7d", "30d" ] }, "timezone": "browser", "title": "App Metrics - Web Monitoring - InfluxDB", "version": 21}最后启动AspNetCore站点,再建立点post get put什么的控制器和Action随便访问几次就可以了

关于AspNet Core下如何利用app-metrics+Grafana + InfluxDB实现高大上的性能监控界面问题的解答就分享到这里了,希望以上内容可以对大家有一定的帮助,如果你还有很多疑惑没有解开,可以关注编程网精选频道了解更多相关知识。
--结束END--
本文标题: AspNet Core下如何利用app-metrics+Grafana + InfluxDB实现高大上的性能监控界面
本文链接: https://www.lsjlt.com/news/295307.html(转载时请注明来源链接)
有问题或投稿请发送至: 邮箱/279061341@qq.com QQ/279061341
下载Word文档到电脑,方便收藏和打印~
2024-05-16
2024-05-16
2024-05-16
2024-05-16
2024-05-16
2024-05-16
2024-05-16
2024-05-16
2024-05-16
2024-05-16
回答
回答
回答
回答
回答
回答
回答
回答
回答
回答


官方手机版

微信公众号

商务合作


0