这篇文章主要介绍Vue+Openlayer如何实现图形的拖动和旋转变形效果,文中介绍的非常详细,具有一定的参考价值,感兴趣的小伙伴们一定要看完!实现效果旋转、拖动图1、实现效果图2、旋转效果图3、左右移动效果 实现步骤vue中引入
这篇文章主要介绍Vue+Openlayer如何实现图形的拖动和旋转变形效果,文中介绍的非常详细,具有一定的参考价值,感兴趣的小伙伴们一定要看完!
旋转、拖动
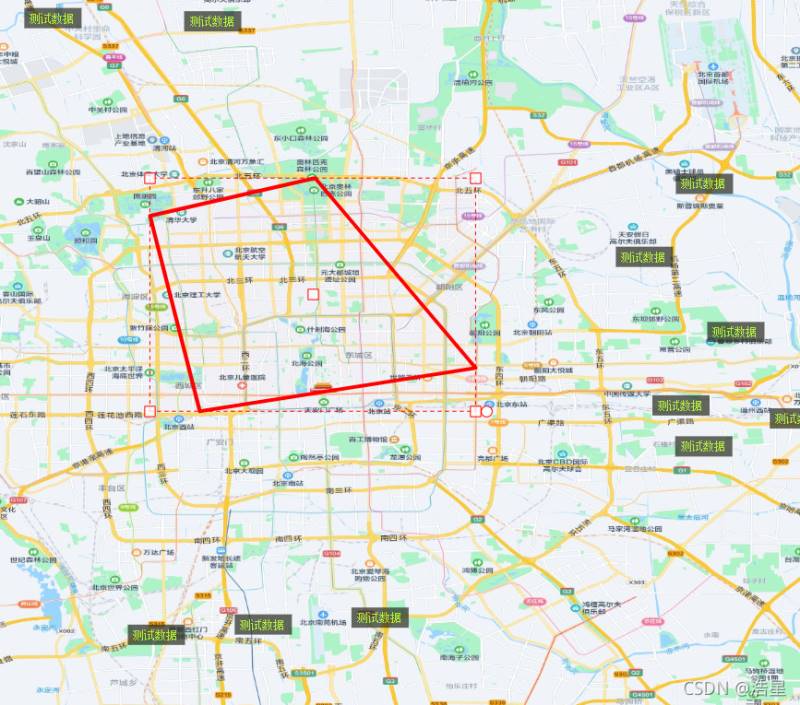
图1、实现效果
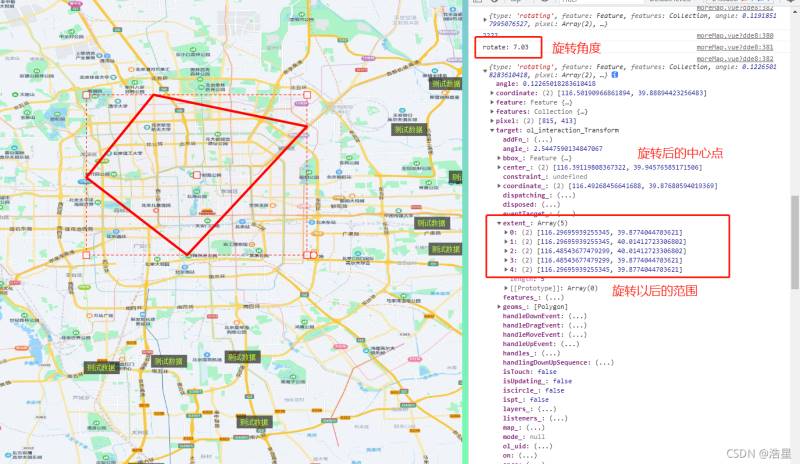
图2、旋转效果
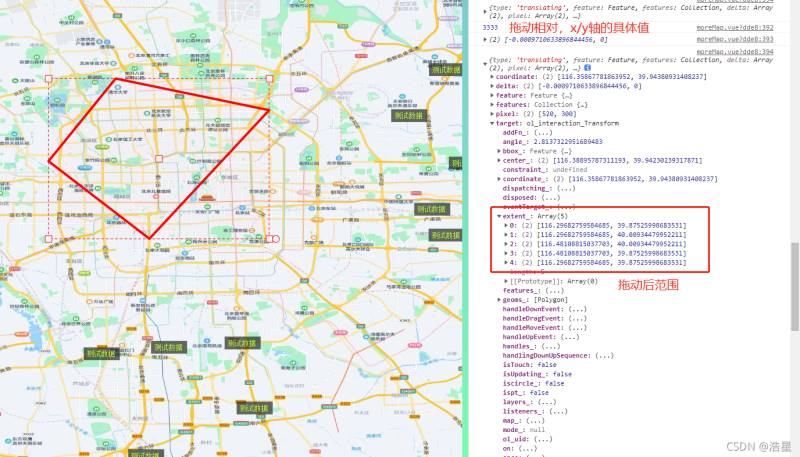
图3、左右移动效果
vue中引入openlayers
npm i ol --save附:npm下载指定版本命令,需要可以拿去
npm install --save-dev ol@6.9.0vue中引入 openlayers的扩展包 ol-ext
npm install ol-ext --save附:npm下载指定版本命令,需要可以拿去
npm install --save ol-ext@3.2.16创建地图容器
<template> <div id="map" class="map"></div></template>js中引入具体配置,根据你的具体改,我这里放的是我自己的
ol有关:
import "ol/ol.CSS";import View from "ol/View";import Map from "ol/Map";import TileLayer from "ol/layer/Tile";import Overlay from "ol/Overlay";import XYZ from "ol/source/XYZ";import { Vector as SourceVec ,Cluster,Vector as VectorSource } from "ol/source";import { Feature } from "ol";import { Vector as LayerVec , Vector as VectorLayer } from "ol/layer";import { Point, LineString, PolyGon } from "ol/geom"; import { Style, Icon, Fill, Stroke, Text, Circle as CircleStyle, } from "ol/style"; import { OSM, TileArcGISRest } from "ol/source";ol-ext有关:
import ExtTransfORM from 'ol-ext/interaction/Transform'实现地图方法:
data() { return { map: null, center: [116.39702518856394, 39.918590567855425], //北京故宫的经纬度 centerSize: 11.5, projection: "EPSG:4326", }}mounted() { this.initMap()}methods: { //初始化地图 initMap() { //渲染地图 var layers = [ //深蓝色背景 // new TileLayer({ // source: new XYZ({ // url: // "https://map.geoq.cn/ArcGIS/rest/services/ChinaOnlineStreetPurplishBlue/MapServer/tile/{z}/{y}/{x}", // }), // }), //初始化背景 // new TileLayer({ // source: new OSM(), // }) new TileLayer({ title: "街道图", source: new XYZ({ url: "Http://localhost:8888/haoxing-map/sosomaps/roadmap/{z}/{x}/{y}.jpg",//zwh本地使用 }), }), ]; this.map = new Map({ layers: layers, target: "map", view: new View({ center: this.center, projection: this.projection, zoom: this.centerSize, maxZoom: 17, minZoom: 8, }), }); },地图上加上多边形数据
mounted() { this.initMap() this.createPolygon()}, methods: { //创建多边形 createPolygon() { //添加图层,并设置点范围 const polygon = new Feature({ geometry: new Polygon([ [ [116.39314093500519,40.0217660530101], [116.47762344990831,39.921746523871924], [116.33244947314951,39.89892653421418], [116.30623076162784,40.00185925352143], ] ]), }) //设置样式 polygon.setStyle(new Style({ stroke: new Stroke({ width: 4, color: [255, 0, 0, 1], }), })) //将图形加到地图上 this.map.addLayer(new VectorLayer({ source: new VectorSource({ features: [polygon], }), })) }, }地图上添加具体的操作方法和效果
mounted() { this.initMap() this.createPolygon() this.onEdit()},//操作事件onEdit() { const transform = new ExtTransform({ enableRotatedTransform: false, hitTolerance: 2, translate: true, // 拖拽 stretch: false, // 拉伸 scale: true, // 缩放 rotate: true, // 旋转 translateFeature: false, noFlip: true, // layers: [], }) this.map.addInteraction(transform) //开始事件 transform.on(['rotatestart','translatestart'], function(e){ // Rotation let startangle = e.feature.get('angle')||0; // Translation console.log(1111); console.log(startangle); }); //旋转 transform.on('rotating', function (e){ console.log(2222); console.log("rotate: "+((e.angle*180/Math.PI -180)%360+180).toFixed(2)); console.log(e); }); //移动 transform.on('translating', function (e){ console.log(3333); console.log(e.delta); console.log(e); }); //拖拽事件 transform.on('scaling', function (e){ console.log(4444); console.log(e.scale); console.log(e); }); //事件结束 transform.on(['rotateend', 'translateend', 'scaleend'], function (e) { console.log(5555); }); },以上是“Vue+Openlayer如何实现图形的拖动和旋转变形效果”这篇文章的所有内容,感谢各位的阅读!希望分享的内容对大家有帮助,更多相关知识,欢迎关注编程网精选频道!
--结束END--
本文标题: Vue+Openlayer如何实现图形的拖动和旋转变形效果
本文链接: https://www.lsjlt.com/news/300659.html(转载时请注明来源链接)
有问题或投稿请发送至: 邮箱/279061341@qq.com QQ/279061341
下载Word文档到电脑,方便收藏和打印~
2024-05-09
2024-05-09
2024-05-09
2024-05-09
2024-05-09
2024-05-09
2024-05-09
2024-05-09
2024-05-09
2024-05-09
回答
回答
回答
回答
回答
回答
回答
回答
回答
回答


官方手机版

微信公众号

商务合作


0