本篇内容介绍了“如何使用Vue实现柱形图”的有关知识,在实际案例的操作过程中,不少人都会遇到这样的困境,接下来就让小编带领大家学习一下如何处理这些情况吧!希望大家仔细阅读,能够学有所成!使用vue实现柱形图的方法:1、创建div属性为“&l
本篇内容介绍了“如何使用Vue实现柱形图”的有关知识,在实际案例的操作过程中,不少人都会遇到这样的困境,接下来就让小编带领大家学习一下如何处理这些情况吧!希望大家仔细阅读,能够学有所成!
使用vue实现柱形图的方法:1、创建div属性为“<div ref="BarChart" style="height: 1000px; width: 100%"/>”;2、通过“mounted(){this.fetchData()window.addEventListener('resize',()=>{if (this.chart){...}”实现立体柱状图即可。
vue 实现立体柱状图
样式如下图所示: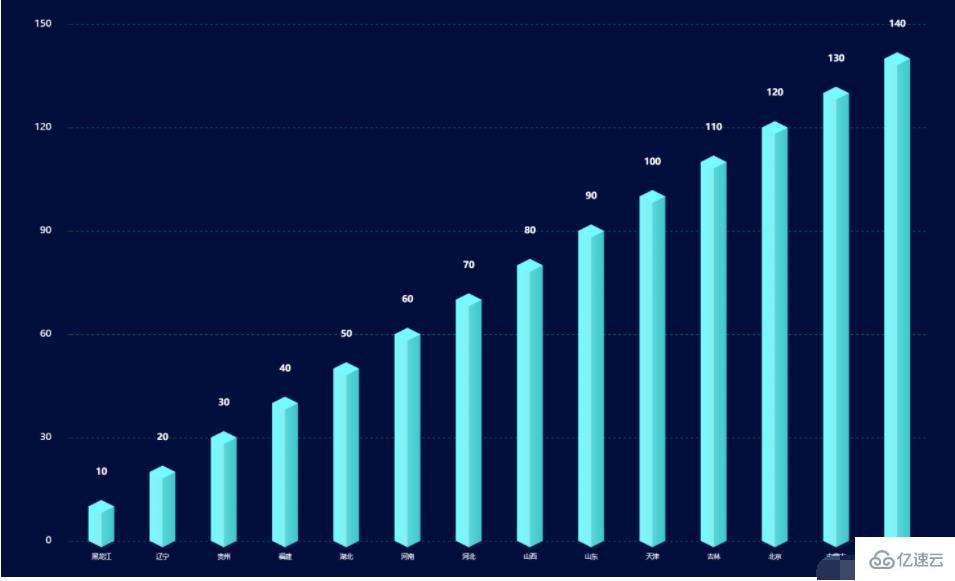
可以将立体柱状图看做由yData+底+顶构成,对应代码如下:
<template>
  <div ref="BarChart" style="height: 1000px; width: 100%"/></template>
<script>import echarts from 'echarts'export default { data() { return { chart: null, data: [], //数据 xData: [], //x轴 yBarData: [], //y轴 yLable: [], colorStops: [], chartLegend: [], //图例 colorOptions: [ //图例以及柱形图颜色选择 '#5ba2e4', '#f58510', '#afa5a5', '#facb3D', '#0854cf', '#48c611', '#082b63' ] } }, mounted() { this.fetchData() //图的大小自适应 window.addEventListener('resize',()=>{ if (this.chart){ this.chart.resize() } }) }, beforeDestroy() { //实例销毁之前调用 if (!this.chart) { return } this.chart.dispose() this.chart = null }, methods: { fetchData() { this.xData = ["黑龙江",'辽宁','贵州','福建','湖北','河南','河北','山西','山东','天津','吉林','北京','内蒙古','云南'] this.yLable = ['10','20','30','40','50','60','70','80','90','100','110','120','130','140'] this.chartLegend = [] const dateArr = [] this.yLable.forEach((item, index) => { if (item !== null && item !== undefined) { dateArr.push(this.yLable[index]) } }) this.chartLegend = dateArr this.initData() this.initChart() }, initData() { this.yBarData = this.yLable }, initChart() { this.chart = echarts.init(this.$refs.BarChart) this.chart.clear() // 清空当前实例 let colors = [] const dom = 800 const barWidth = dom / 20 for (let i = 0; i < 4; i++) { colors.push({ colorStops: [ { offset: 0, color: '#73fcff' // 最左边 }, { offset: 0.5, color: '#86eef1' // 左边的右边 颜色 }, { offset: 0.5, color: '#5ad6d9' // 右边的左边 颜色 }, { offset: 1, color: '#3dc8ca' }] }) } this.chart.setOption({ backgroundColor: '#010d3a', //提示框 tooltip: { trigger: 'axis', fORMatter: "{b} : {c}", axisPointer: { // 坐标轴指示器,坐标轴触发有效 type: 'shadow' // 默认为直线,可选为:'line' | 'shadow' } }, grid: { left: '10%', right: '10%', top: '10%', bottom: '10%', }, //X轴 xAxis: [{ data: this.xData, type: 'cateGory', show: true, axisLine: { show: false, lineStyle: { color: 'rgba(255,255,255,1)', shadowColor: 'rgba(255,255,255,1)', // shadowOffsetX: '20' }, symbol: ['none', 'arrow'], symbolOffset: [0, 25] }, splitLine: { show: false }, axisTick: { show: false }, axisLabel: { margin: 20, fontSize: 10 } }], yAxis: { show: true, splitNumber: 4, axisLine: { show: false }, splitLine: { show: true, lineStyle: { type: 'dashed', color: '#075858' }, }, axisLabel: { show: true, color: '#FFFFFF', margin: 30, fontSize: 15 } }, series: [ {//数据颜色 name: '日付费用户数', type: 'bar', barWidth: barWidth, itemStyle: { normal: { color: (params) => { return colors[params.dataindex % 4]; } } }, label: { show: true, position: [barWidth / 2, -(barWidth + 20)], color: '#ffffff', fontSize: 14, fontStyle: 'bold', align: 'center' }, data: this.yBarData }, {//底 z: 2, type: 'pictorialBar', data: this.yBarData, symbol: 'diamond', symbolOffset: [0, '50%'], symbolSize: [barWidth, barWidth * 0.5], itemStyle: { normal: { color: (params) => { return colors[params.dataIndex % 4] } } } }, {//顶 z: 3, type: 'pictorialBar', symbolPosition: 'end', data: this.yBarData, symbol: 'diamond', symbolOffset: [0, '-50%'], symbolSize: [barWidth, barWidth * 0.5], itemStyle: { normal: { borderWidth: 0, color: (params) => { return colors[params.dataIndex % 4].colorStops[0].color; } } } } ] }, true) } }}</script>
上述js代码中,有如下注意事项:
颜色选择:可以将colors[params.dataIndex % 4]替换为this.colorOptions[params.dataIndex % 4],即使用代码中定义的colorOptions进行颜色填充
colorStops保证了立体的效果
代码中colors[params.dataIndex % 4]中的4的选取是可变的,保证索引值在colors变量的长度范围内。例如:本例中colors长度为4,params.dataIndex % 4不超过4即可
引用上述barchart可应用如下代码:
<template>
  <bar-chart /></template>
<script>import barChart from "./components/barChart"export default { name: 'barchart', components: { barChart }}</script>
“如何使用vue实现柱形图”的内容就介绍到这里了,感谢大家的阅读。如果想了解更多行业相关的知识可以关注编程网网站,小编将为大家输出更多高质量的实用文章!
--结束END--
本文标题: 如何使用vue实现柱形图
本文链接: https://www.lsjlt.com/news/348892.html(转载时请注明来源链接)
有问题或投稿请发送至: 邮箱/279061341@qq.com QQ/279061341
下载Word文档到电脑,方便收藏和打印~
2024-05-24
2024-05-24
2024-05-24
2024-05-24
2024-05-24
2024-05-24
2024-05-24
2024-05-24
2024-05-24
2024-05-24
回答
回答
回答
回答
回答
回答
回答
回答
回答
回答


官方手机版

微信公众号

商务合作


0