监控安装部署 监控安装下载所需包: 下载地址:Download | Prometheus Grafana下载 官网下载Download Grafana | Grafana Labs(速度较慢) 国内镜像Grafana 国内加速下载 |
监控安装下载所需包:
Grafana下载
官网下载Download Grafana | Grafana Labs(速度较慢)
国内镜像Grafana 国内加速下载 | newbe(推荐)
所有相关包的和监控模板下载地址:
阿里云盘:
执行:
[root@gtdms ~]# yum localinstall -y grafana-enterprise-9.1.1-1.x86_64.rpm[root@gtdms ~]# systemctl daemon-reload && systemctl start grafana-server && systemctl enable grafana-server[root@gtdms ~]# systemctl status grafana-server● grafana-server.service - Grafana instance Loaded: loaded (/usr/lib/systemd/system/grafana-server.service; enabled; vendor preset: disabled) Active: active (running) since Aug 26 15:28:57 CST; 5s aGo Docs: Http://docs.grafana.org Main PID: 3628 (grafana-server) CGroup: /system.slice/grafana-server.service └─3628 /usr/sbin/grafana-server --config=/etc/grafana/grafana.ini --pidfile=/var/run/grafana/grafana-server.pid --packaging=rpm cfg:default.paths.logs=/var/lo...........Aug 26 15:28:57 monitor grafana-server[3628]: t=2022-08-26T15:28:57+0800 lvl=info msg="Initializing TracingService" logger=serverAug 26 15:28:57 monitor systemd[1]: Started Grafana instance.Aug 26 15:28:57 monitor grafana-server[3628]: t=2022-08-26T15:28:57+0800 lvl=info msg="Initializing Stream Manager"Aug 26 15:28:57 monitor grafana-server[3628]: t=2022-08-26T15:28:57+0800 lvl=info msg="HTTP Server Listen" logger=http.server address=0.0.0.0:3000 protocol=htt...l= Socket=Aug 26 15:28:57 monitor grafana-server[3628]: t=2022-08-26T15:28:57+0800 lvl=info msg="cleanup of expired auth tokens done" logger=auth count=0Hint: Some lines were ellipsized, use -l to show in full.启动有两种:
第一种:通过系统调用启动【本次使用】
[root@gtdms grafana]# /sbin/chkconfig --add grafana-server [root@gtdms grafana]# service grafana-server start Starting grafana-server (via systemctl): [ OK ] 注意需要等到OK出现

启动:
service grafana-server start停止:
service grafana-server stop 第二种:二进制方式启动
#查询安装位置 find / -name 'grafana'
一般默认安装位置为:
/usr/sbin/grafana-cli /usr/sbin/grafana-server
#启动
/usr/sbin/grafana-server WEB --config /etc/grafana/grafana.ini
#如果不加 --config 参数 Grafana 默认会去读 conf/custom.ini 配置文件
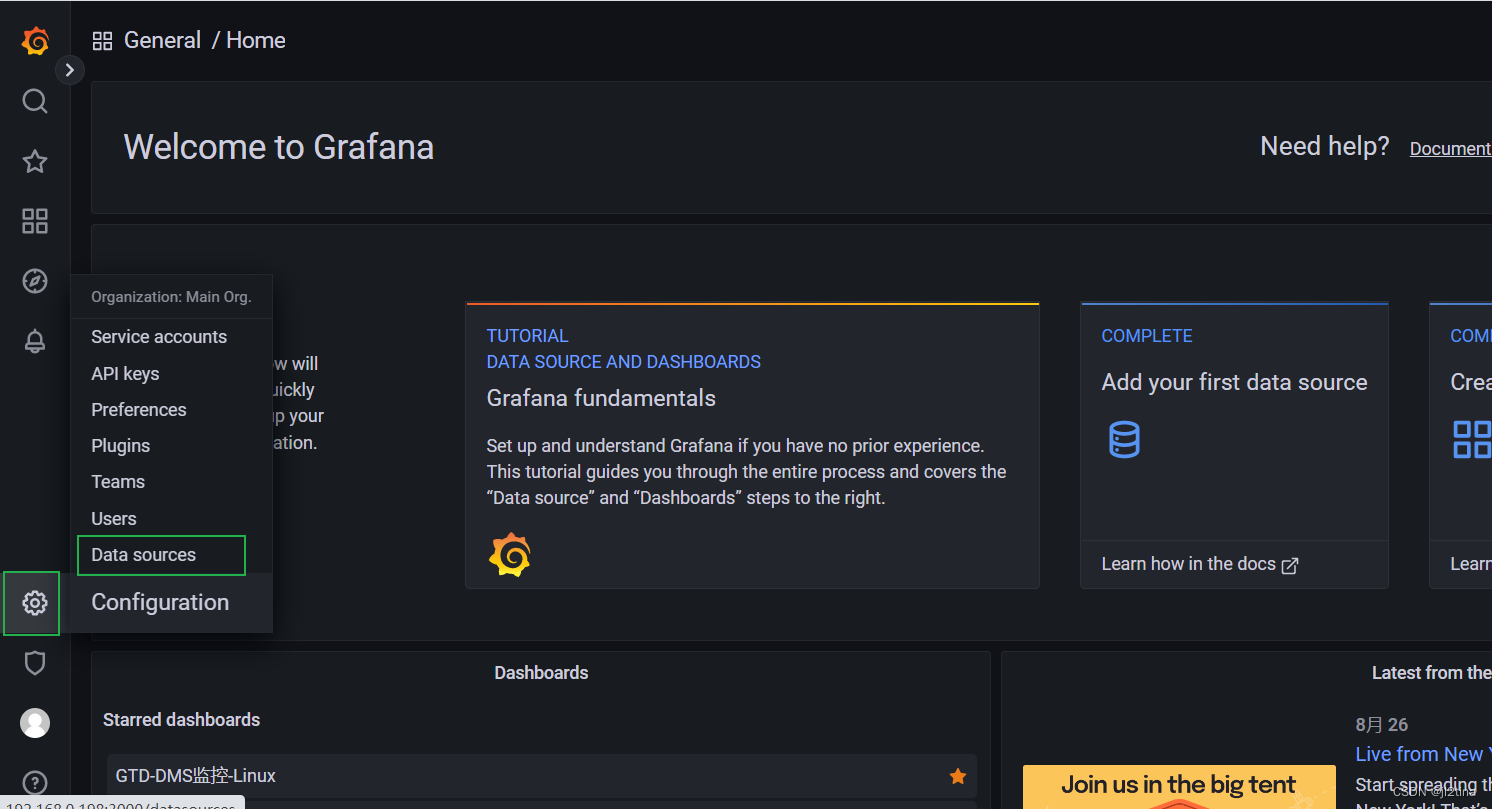
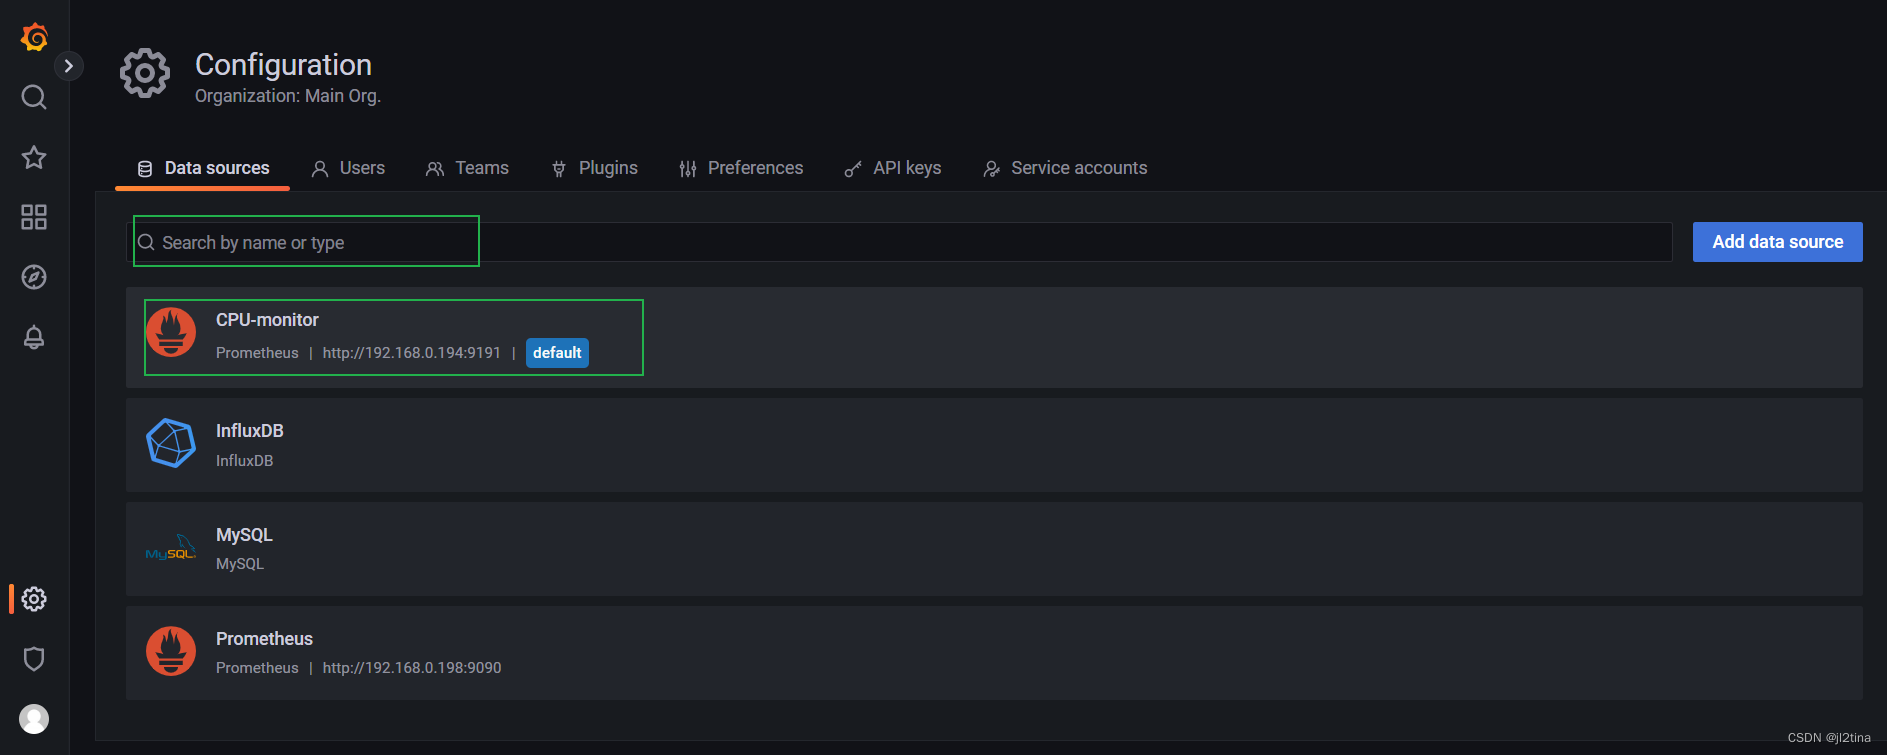
界面访问地址:
默认账号: admin
默认密码: admin
实际已修改为admin123
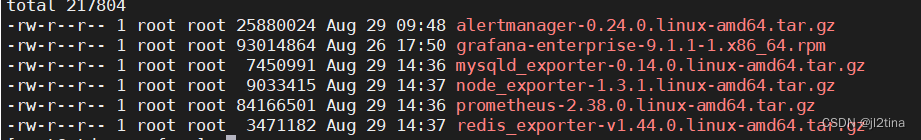
软件包存放目录为:/root/
 2、解压prometheus-2.38.0.linux-amd64.tar.gz
[root@gtdms ~]# tar -xvf prometheus-2.38.0.linux-amd64.tar.gz[root@gtdms ~]# cp /root/prometheus-2.38.0.linux-amd64/{prometheus,promtool} /usr/local/bin/[root@gtdms ~]# mkdir -p /etc/prometheus && mkdir -p /data/gtdms/prometheus[root@gtdms ~]# vi /usr/lib/systemd/system/prometheus.service[Unit]Description=Prometheus: the monitoring systemDocumentation=http://prometheus.io/docs/[Service]ExecStart=/usr/local/bin/prometheus --config.file=/etc/prometheus/prometheus.yml --storage.tsdb.path=/data/gtdms/prometheusRestart=alwaysStartLimitInterval=0RestartSec=10[Install]WantedBy=multi-user.target[root@gtdms ~]# cp -p /root/prometheus-2.38.0.linux-amd64/prometheus.yml /etc/prometheus[root@gtdms ~]# systemctl daemon-reload && systemctl restart prometheus [root@gtdms ~]# systemctl status prometheus● prometheus.service - Prometheus: the monitoring system Loaded: loaded (/usr/lib/systemd/system/prometheus.service; disabled; vendor preset: disabled) Active: active (running) since Mon 2022-08-29 10:28:57 CST; 5s ago Docs: http://prometheus.io/docs/ Main PID: 11306 (prometheus) Tasks: 19 Memory: 17.0M CGroup: /system.slice/prometheus.service └─11306 /usr/local/bin/prometheus --config.file=/etc/prometheus/prometheus.yml --storage.tsdb.path=/data/gtdms/prometheus..........Aug 29 10:28:57 gtdms prometheus[11306]: ts=2022-08-29T02:28:57.527Z caller=main.go:1218 level=info msg="Completed loading of configuration file" filename=/etc/promet…µsAug 29 10:28:57 gtdms prometheus[11306]: ts=2022-08-29T02:28:57.527Z caller=main.go:961 level=info msg="Server is ready to receive web requests."Aug 29 10:28:57 gtdms prometheus[11306]: ts=2022-08-29T02:28:57.527Z caller=manager.go:941 level=info component="rule manager" msg="Starting rule manager..."Hint: Some lines were ellipsized, use -l to show in full.[root@gtdms ~]# wget https://GitHub.com/prometheus/node_exporter/releases/download/v0.18.1/node_exporter-0.18.1.linux-amd64.tar.gz[root@gtdms ~]# tar -xvf node_exporter-0.18.1.linux-amd64.tar.gz[root@gtdms ~]# mv /root/node_exporter-0.18.1.linux-amd64/node_exporter /usr/local/bin[root@gtdms ~]# vi /etc/systemd/system/node_exporter.service[Unit]Description=node_exporterDocumentation=https://prometheus.io/After=network.target[Service]ExecStart=/usr/local/bin/node_exporterRestart=on-failure[Install]WantedBy=multi-user.target[root@gtdms ~]# systemctl daemon-reload && systemctl restart node_exporter && systemctl enable node_exporter# 查看node_exporter状态[root@gtdms ~]# systemctl status node_exporter● node_exporter.service - node_exporter Loaded: loaded (/etc/systemd/system/node_exporter.service; enabled; vendor preset: disabled) Active: active (running) since Mon 2022-08-29 11:16:21 CST; 17s ago Docs: https://prometheus.io/ Main PID: 3731 (node_exporter) CGroup: /system.slice/node_exporter.service └─3731 /usr/local/bin/node_exporter..............level=info msg="Listening on :9100" source="node_exporter.go:170"# 启动后,配置prometheus.yml[root@gtdms ~]# vi /etc/prometheus/prometheus.ymlscrape_configs: # The job name is added as a label `job=` to any timeseries scraped from this config. - job_name: "prometheus" # metrics_path defaults to '/metrics' # scheme defaults to 'http'. static_configs: - targets: ["192.168.0.198:9100"] - job_name: "node info" static_configs: - targets: ['192.168.0.198:9090'] - job_name: "Mysql-198" static_configs: - targets: ['192.168.0.198:9104'] - job_name: "Redis-198" static_configs: - targets: ['192.168.0.198:9121'] - job_name: "linux-198" static_configs: - targets: ['192.168.0.198:9222'] # 重新启动prometheus[root@gtdms ~]# systemctl restart prometheus 重要配置:
vim /usr/local/prometheus/prometheus.yml
systemctl restart prometheus
注意点:
在prometheus的配置文件prometheus.yml中添加node_exporter组件(一定要注意空格,不然会报错的)
# 新增,采集node_exporter监控数据 - job_name: "node-168" static_configs: - targets: ['192.168.x.x:9100'] - job_name: "node-174" static_configs: - targets: ['192.168.x.x:9100']或直接加到prometheus后面,这样的话之后加入的组件不好区分,推荐上面的配置。
# 新增,采集node_exporter监控数据 - job_name: "node-168" static_configs: - targets: ['192.168.x.x:9100','192.168.x.x:9100']访问prometheus server
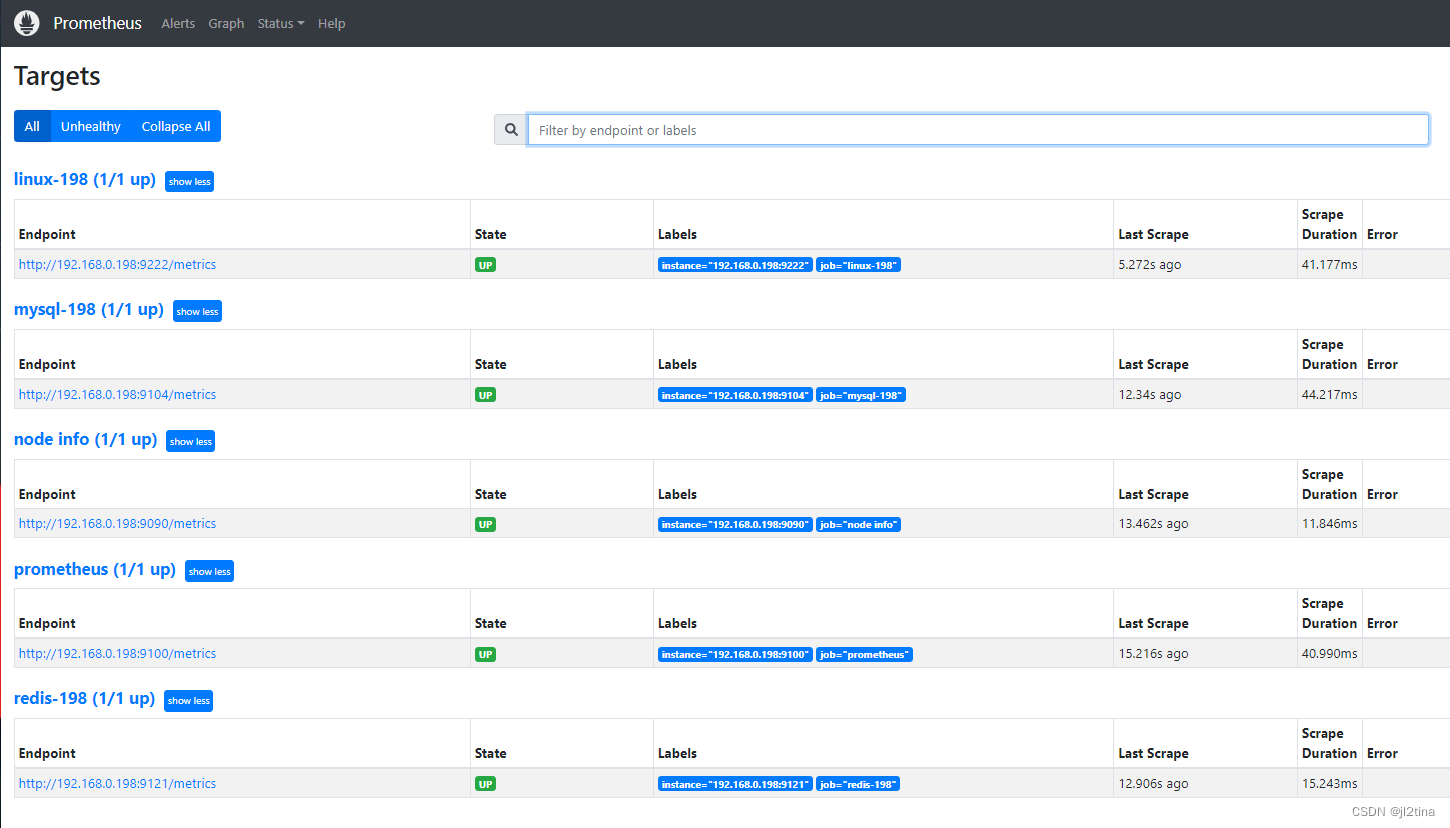
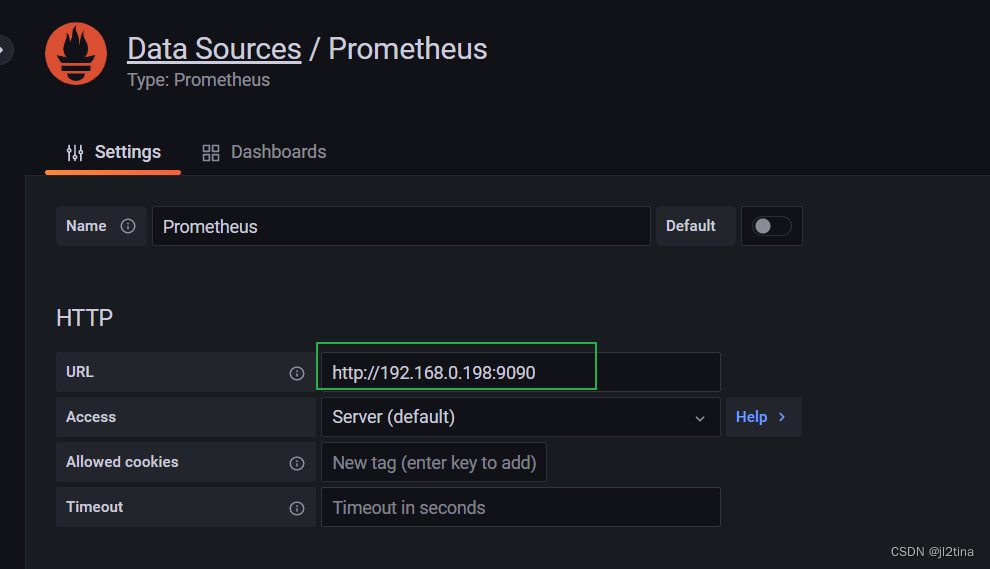
这里访问http://${IP}:9090,进入prometheus server,可以看到node info处于up状态,表示prometheus能正常从node_exporter获取数据:
访问:http://192.168.0.198:9090/targets
# 在MySQL服务器上创建监控用户mysql -uroot -p123456 #创建mysql的监控用户专用账号mysql>CREATE USER 'mysql_monitor'@'localhost' IDENTIFIED BY '123' WITH MAX_USER_CONNECTIONS 3;mysql> grant select,replication client, process on *.* to 'mysql_monitor'@'localhost' identified by '123';Query OK, 0 rows affected, 1 warning (0.00 sec)mysql> flush privileges;Query OK, 0 rows affected (0.03 sec)mysql> exitBye# 将上面创建的mysql用户信息写入mysqld_exporter配置文件(新创建一个)[root@gtdms ~]# vim /root/mysqld_exporter/.my.cnf[client]user=mysql_monitorpassWord=123另外,官方提供了一种方式采用环境变量方式配置账号密码# 启动mysqld_exporternohup /root/mysqld_exporter/mysqld_exporter --config.my-cnf=/root/mysqld_exporter/.my.cnf &# 确认是否正常启动(默认端口9104)[root@gtdms ~]# netstat -lnptu | grep 9104tcp6 0 0 :::9104 :::* LISTEN 32688/mysqld_export 解压安装包
[root@gtdms ~]# tar -xf redis_exporter-v1.44.0.linux-amd64.tar.gz[root@gtdms ~]# mv /root/redis_exporter-v1.44.0.linux-amd64.tar.gz/redis_exporter /usr/local/bin[root@gtdms ~]# vi /etc/systemd/system/redis_exporter.service[Unit]Description=redis_exporterDocumentation=https://github.com/oliver006/redis_exporterAfter=network.target[Service]Type=simpleUser=prometheusExecStart=/usr/local/bin/redis_exporter -redis.addr 192.168.0.198:6379 -redis.password 123456 -web.listen-address 192.168.0.198:9121Restart=on-failure[Install]WantedBy=multi-user.target[root@gtdms ~]# systemctl daemon-reload && systemctl restart redis_exporter && systemctl enable redis_exporter# 查看node_exporter状态[root@gtdms ~]# systemctl status redis_exporter查看服务端口号进程:ss -tln | grep 9121redis_exporter 运行参数说明: 可以通过./redis_exporter --help命令查看各个参数的含义,比较常用的参数如下 :
-redis.addr string:Redis实例的地址,可以使一个或者多个,多个节点使用逗号分隔,默认为 "redis://localhost:6379"-redis.password string:Redis实例的密码 -web.listen-address string:服务监听的地址,默认为 0.0.0.0:9121--storage.tsdb.retention.size:[EXPERIMENTAL]要保留的最大存储块字节数。最旧的数据将首先被删除。默认为0或禁用。该标志是试验性的,将来的发行版中可能会更改。支持的单位:B,KB,MB,GB,TB,PB,EB。例如:“ 512MB”--storage.tsdb.path:Prometheus写入数据库的位置。默认为data/。--storage.tsdb.retention.time:何时删除旧数据。默认为15d。storage.tsdb.retention如果此标志设置为默认值以外的任何值,则覆盖。下载监控模板:Dashboards | Grafana Labs
1 Node Exporter Dashboard 22/04/13 ConsulManager自动同步版 | Grafana Labs
Redis Dashboard for Prometheus Redis Exporter (helm stable/redis-ha) | Grafana Labs
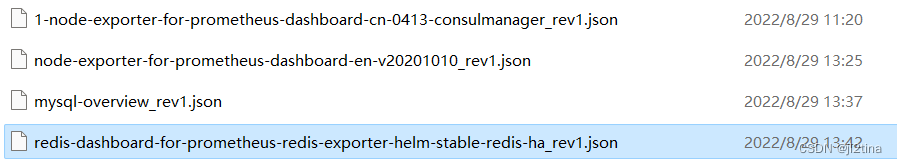
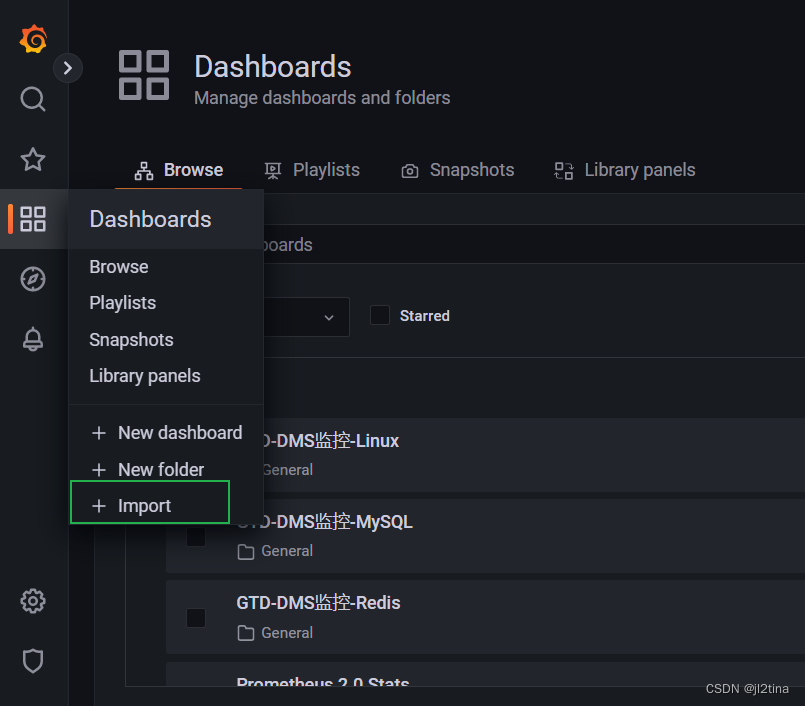
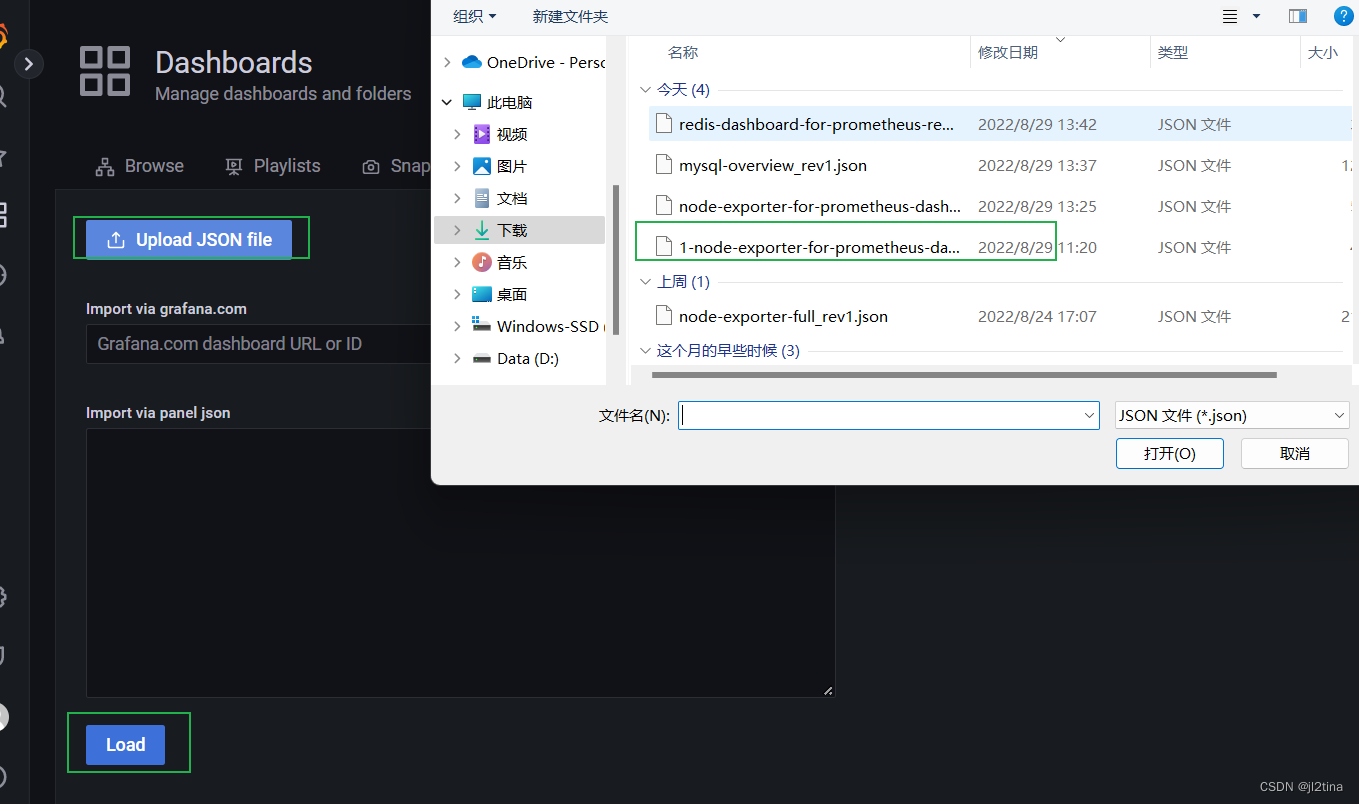
 配置linux监控,先导入
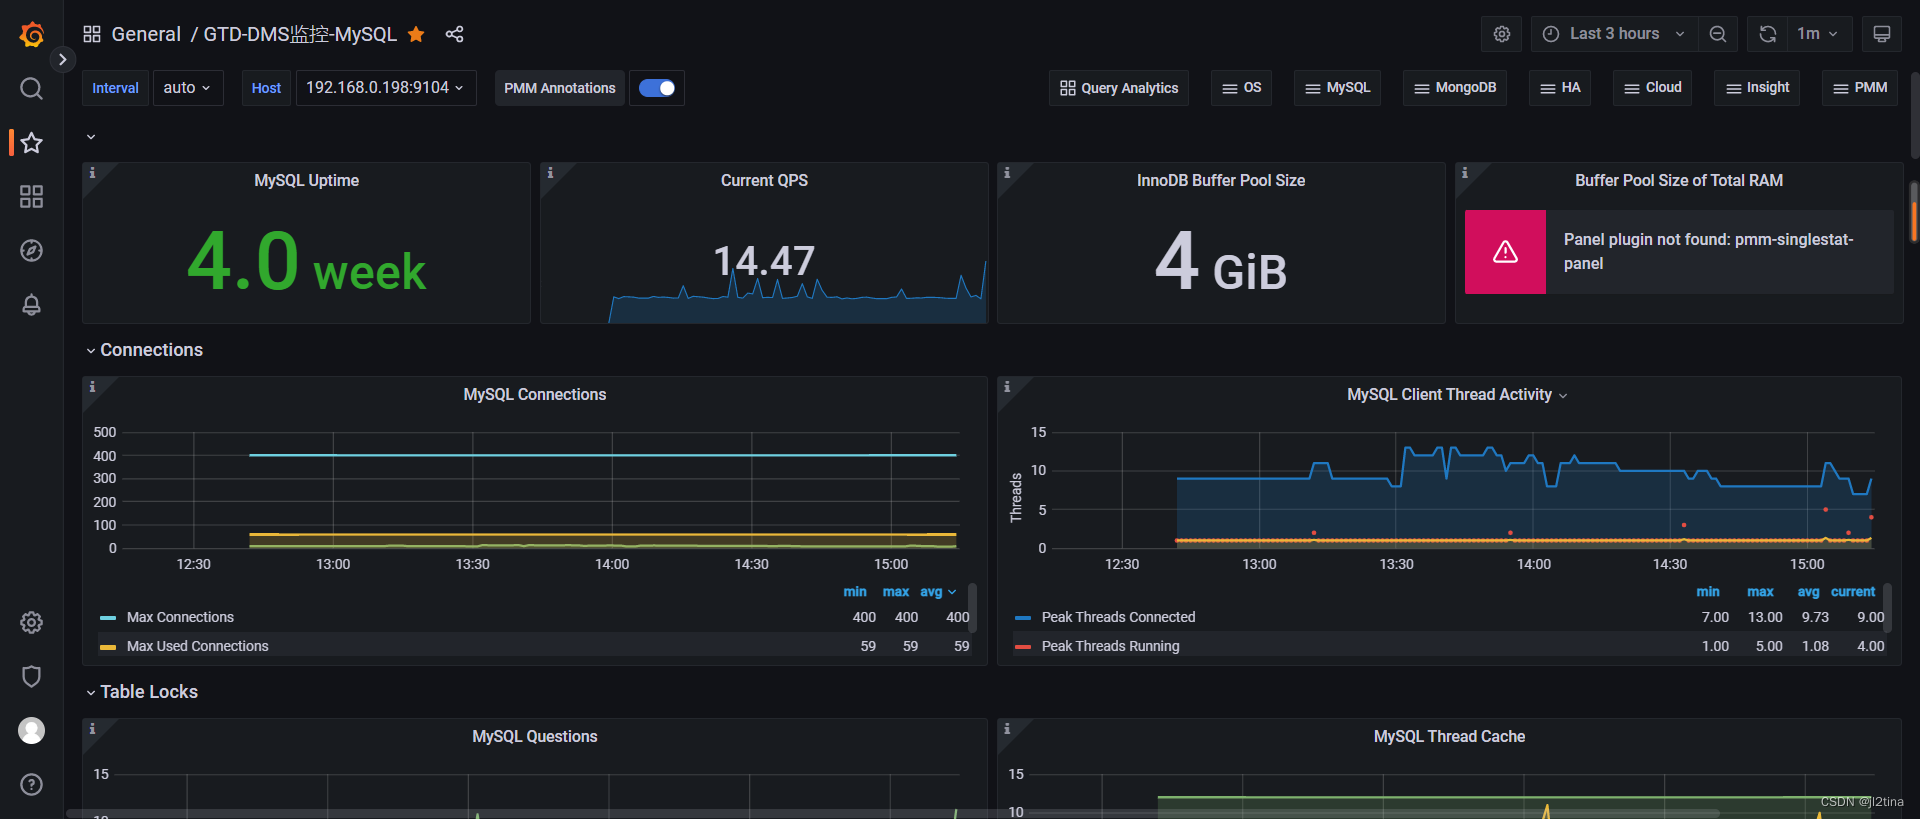
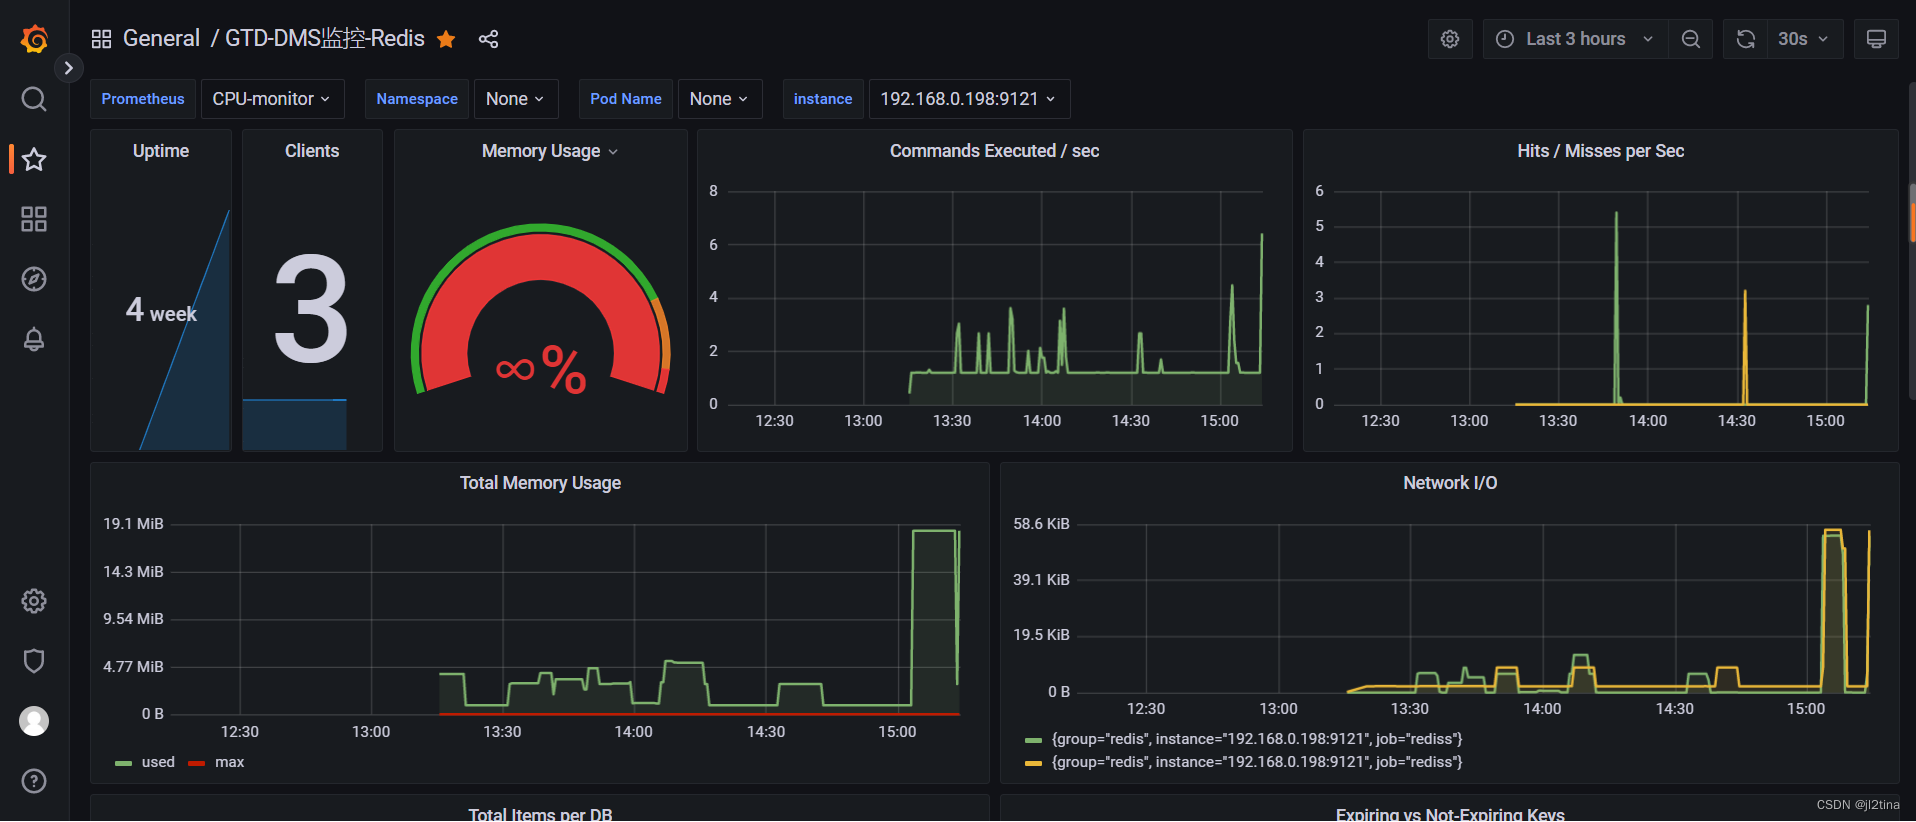
 其他redis、mysql等配置都是一样
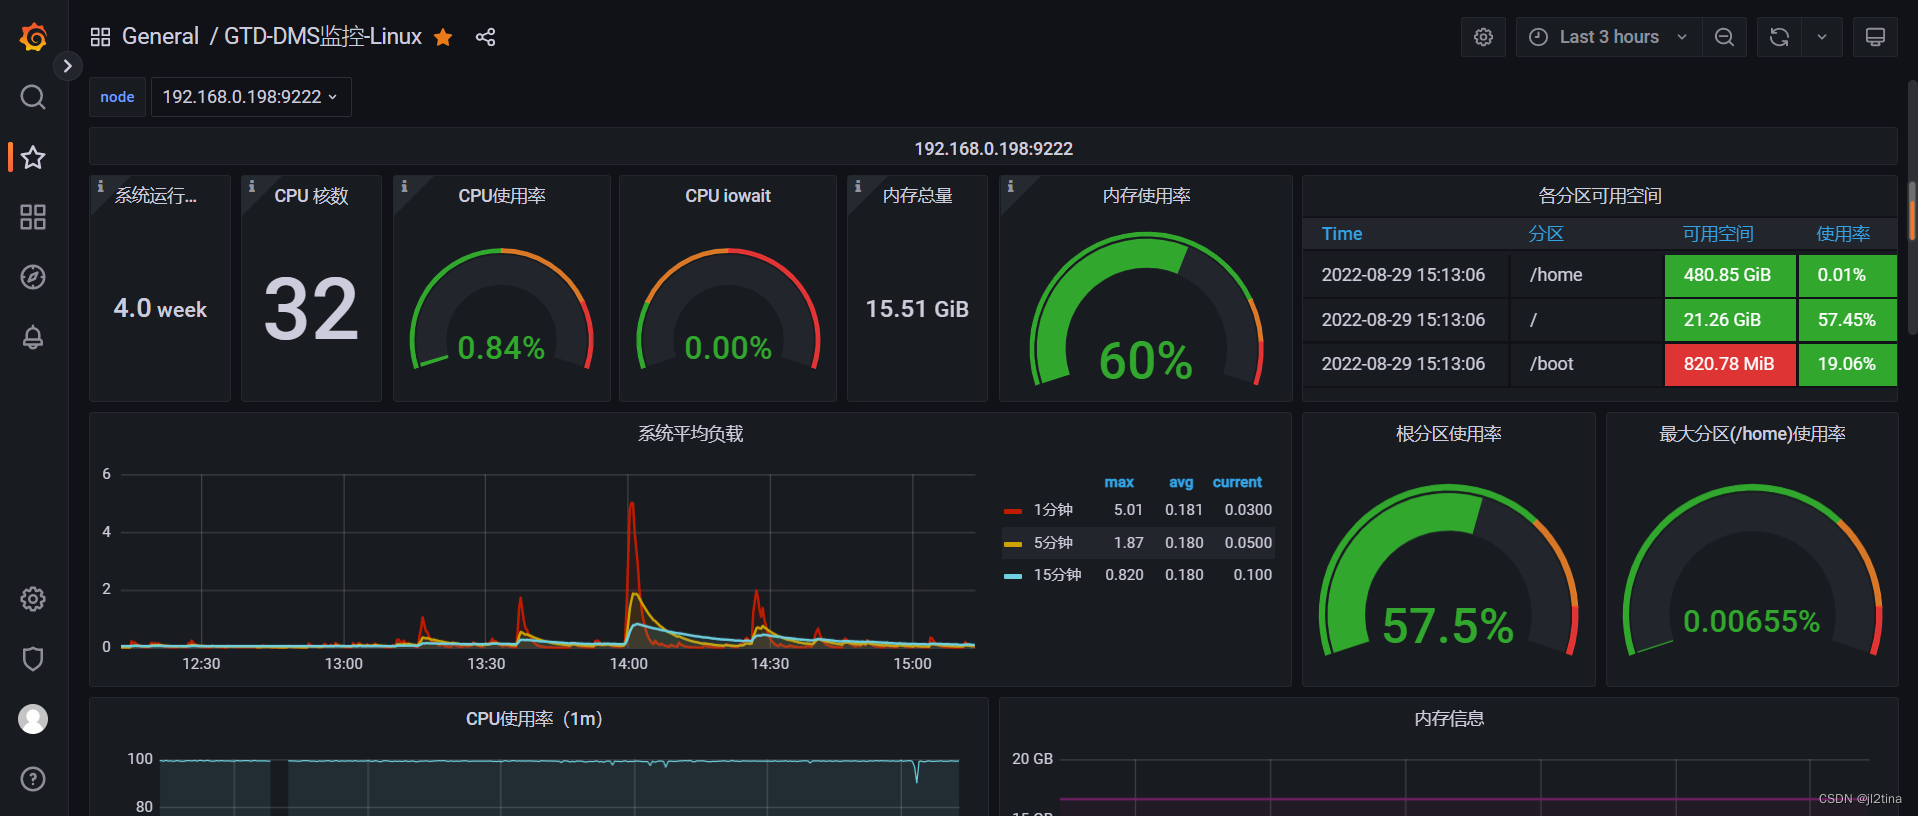
七、最终效果
八、注意点
prometheus 的默认存储监控数据时间为15天;
配置文件地址为:/etc/prometheus/prometheus.yml
prometheus启动命令为:
/root/prometheus-2.38.0.linux-amd64/prometheus \--web.listen-address="192.168.0.198:9090" \--storage.tsdb.retention.time=10d \--storage.tsdb.retention.size=20GB \--config.file="/etc/prometheus/prometheus.yml"来源地址:https://blog.csdn.net/qq_35139965/article/details/126588206
--结束END--
本文标题: grafana、prometheus监控linux、mysql等
本文链接: https://www.lsjlt.com/news/384852.html(转载时请注明来源链接)
有问题或投稿请发送至: 邮箱/279061341@qq.com QQ/279061341
下载Word文档到电脑,方便收藏和打印~
2024-04-29
2024-04-29
2024-04-29
2024-04-29
2024-04-29
2024-04-29
2024-04-29
2024-04-28
2024-04-28
2024-04-28
回答
回答
回答
回答
回答
回答
回答
回答
回答
回答


官方手机版

微信公众号

商务合作


 下载地址:
下载地址:
0