效果图: 使用series-map.data.itemStyle. color定义每个地区背景色 vue代码 export default { props:{
效果图:
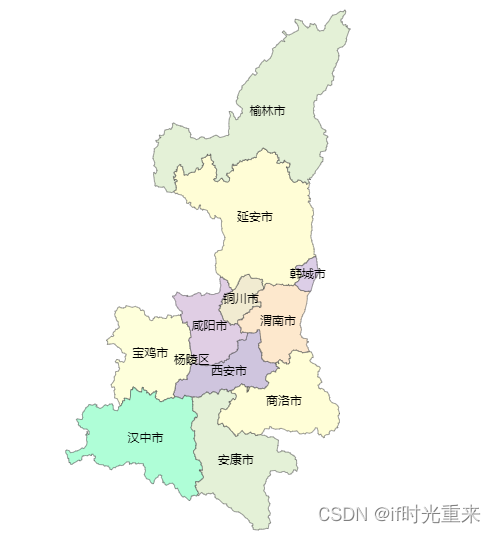
使用series-map.data.itemStyle. color定义每个地区背景色
vue代码
<template> <div class="map"> <div id="frames_cont0" style="width: 100%;height: 100%;">div> div>template><script>export default { props:{ }, data() { return { }; }, methods: { async getDatainfo(){ const {data:res} = await this.$Http.get("get_citylist"); this.change(res.content); }, change(datas){ var city_list=datas.city_list; var city_data=datas.city_data; var city='陕西省'; var chartDom = document.getElementById('frames_cont0'); var myChart = this.$echarts.init(chartDom); var option; myChart.showLoading(); this.$echarts.reGISterMap('Shaanxi', city_list); myChart.hideLoading(); option = { title: { text: city, textStyle:{ color:'#333' }, }, tooltip: { show: false, // 是否显示提示框 }, toolbox: { show: true, orient: 'vertical', left: 'right', top: 'center' }, roam: true, // 滚轮滚动--放大或缩小 visualMap: { show: false, // 是否显示左侧控件 }, series: [ { name: city, type: 'map', mapType: 'Shaanxi', // 自定义扩展图表类型 label: {show: true,color: "#000" }, data: city_data } ], }; option && myChart.setOption(option); var that = this; myChart.on('click', function (params) { var group_id = params.data.group_id; console.log(group_id) that.$emit("changeGroupid", group_id); }); } }, watch: { }, mounted() { this.getDataInfo(); },}script><style> .map{ width:100%; height: 100%; overflow: hidden; }style>后端
// 获取省地图数据 public function get_citylist(){ $path = './static/map_JSON/陕西省.json'; if(file_exists($path)){ $fp = fopen($path,'r'); $str = fread($fp,filesize($path));//指定读取大小,这里把整个文件内容读取出来 fclose($fp); } $city_list = json_decode($str,true); $datas['city_list'] = $city_list; $array = []; // 定义颜色 $color_list = ['#cfc5de','#f1ebd1','#feffdb','#e0cee4','#fde8cd','#fffdd6','#affed7','#e4f1d7','#e4f1d7','#fffed7','#fffed8','#dccee7','#fffed7']; foreach ($city_list['features'] as $k=>$v){ $array[$k]['name'] = $v['properties']['name'];$array[$k]['group_id'] = $v['properties']['groupid']; $array[$k]['value'] = $k+1; $array[$k]['itemStyle'] = ['color'=>$color_list[$k]]; // 设置各个地区背景色 } $datas['city_data'] = $array;$datas['city_data1'] = $groupid; return $output; }来源地址:https://blog.csdn.net/admin_web/article/details/127075712
--结束END--
本文标题: vue实现echarts中的map自定义地图背景色
本文链接: https://www.lsjlt.com/news/389034.html(转载时请注明来源链接)
有问题或投稿请发送至: 邮箱/279061341@qq.com QQ/279061341
下载Word文档到电脑,方便收藏和打印~
2024-02-29
2024-02-29
2024-02-29
2024-02-29
2024-02-29
2024-02-29
2024-02-29
2024-02-29
2024-02-29
2024-02-29
回答
回答
回答
回答
回答
回答
回答
回答
回答
回答


官方手机版

微信公众号

商务合作


0