Python 官方文档:入门教程 => 点击学习
散点图的应用很广泛,以前介绍过很多画图方法:Python画图(直方图、多张子图、二维图形、三维图形以及图中图),漏掉了这个,现在补上,用法很简单,我们可以help(plt.scatter)看下它的用法: Help on fu
散点图的应用很广泛,以前介绍过很多画图方法:Python画图(直方图、多张子图、二维图形、三维图形以及图中图),漏掉了这个,现在补上,用法很简单,我们可以help(plt.scatter)看下它的用法:
Help on function scatter in module matplotlib.pyplot:scatter(x, y, s=None, c=None, marker=None, cmap=None, nORM=None, vmin=None, vmax=None, alpha=None, linewidths=None, verts=None, edgecolors=None, hold=None, data=None, **kwargs) Make a scatter plot of `x` vs `y` Marker size is scaled by `s` and marker color is mapped to `c` Parameters ---------- x, y : array_like, shape (n, ) Input data s : Scalar or array_like, shape (n, ), optional size in points^2. Default is `rcParams['lines.markersize'] ** 2`. c : color, sequence, or sequence of color, optional, default: 'b' `c` can be a single color format string, or a sequence of color specifications of length `N`, or a sequence of `N` numbers to be mapped to colors using the `cmap` and `norm` specified via kwargs (see below). Note that `c` should not be a single numeric RGB or RGBA sequence because that is indistinguishable from an array of values to be colormapped. `c` can be a 2-D array in which the rows are RGB or RGBA, however, including the case of a single row to specify the same color for all points. marker : `~matplotlib.markers.MarkerStyle`, optional, default: 'o' See `~matplotlib.markers` for more information on the different styles of markers scatter supports. `marker` can be either an instance of the class or the text shorthand for a particular marker. cmap : `~matplotlib.colors.Colormap`, optional, default: None A `~matplotlib.colors.Colormap` instance or reGIStered name. `cmap` is only used if `c` is an array of floats. If None, defaults to rc `image.cmap`. norm : `~matplotlib.colors.Normalize`, optional, default: None A `~matplotlib.colors.Normalize` instance is used to scale luminance data to 0, 1. `norm` is only used if `c` is an array of floats. If `None`, use the default :func:`normalize`. vmin, vmax : scalar, optional, default: None `vmin` and `vmax` are used in conjunction with `norm` to normalize luminance data. If either are `None`, the min and max of the color array is used. Note if you pass a `norm` instance, your settings for `vmin` and `vmax` will be ignored. alpha : scalar, optional, default: None The alpha blending value, between 0 (transparent) and 1 (opaque) linewidths : scalar or array_like, optional, default: None If None, defaults to (lines.linewidth,). verts : sequence of (x, y), optional If `marker` is None, these vertices will be used to construct the marker. The center of the marker is located at (0,0) in normalized units. The overall marker is rescaled by ``s``. edgecolors : color or sequence of color, optional, default: None If None, defaults to 'face' If 'face', the edge color will always be the same as the face color. If it is 'none', the patch boundary will not be drawn. For non-filled markers, the `edgecolors` kwarg is ignored and forced to 'face' internally. Returns ------- paths : `~matplotlib.collections.PathCollection` Other parameters ---------------- kwargs : `~matplotlib.collections.Collection` properties See Also -------- plot : to plot scatter plots when markers are identical in size and color Notes ----- * The `plot` function will be faster for scatterplots where markers don't vary in size or color. * Any or all of `x`, `y`, `s`, and `c` may be masked arrays, in which case all masks will be combined and only unmasked points will be plotted. Fundamentally, scatter works with 1-D arrays; `x`, `y`, `s`, and `c` may be input as 2-D arrays, but within scatter they will be flattened. The exception is `c`, which will be flattened only if its size matches the size of `x` and `y`.我们可以看到参数比较多,平时主要用到的就是大小、颜色、样式这三个参数
s:形状的大小,默认 20,也可以是个数组,数组每个参数为对应点的大小,数值越大对应的图中的点越大。
c:形状的颜色,"b":blue "g":green "r":red "c":cyan(蓝绿色,青色) "m":magenta(洋红色,品红色) "y":yellow "k":black "w":white
marker:常见的形状有如下
".":点 ",":像素点 "o":圆形
"v":朝下三角形 "^":朝上三角形 "<":朝左三角形 ">":朝右三角形
"s":正方形 "p":五边星 "*":星型
"h":1号六角形 "H":2号六角形"+":+号标记 "x":x号标记
"D":菱形 "d":小型菱形
"|":垂直线形 "_":水平线形
我们来看几个示例(在一张图显示了)
import matplotlib.pyplot as pltimport numpy as npimport pandas as pdx=np.array([3,5])y=np.array([7,8])x1=np.random.randint(10,size=(25,))y1=np.random.randint(10,size=(25,))plt.scatter(x,y,c='r')plt.scatter(x1,y1,s=100,c='b',marker='*')#使用pandas来读取x2=[]y2=[]rdata=pd.read_table('1.txt',header=None)for i in range(len(rdata[0])): x2.append(rdata[0][i].split(',')[0]) y2.append(rdata[0][i].split(',')[1])plt.scatter(x2,y2,s=200,c='g',marker='o')plt.show()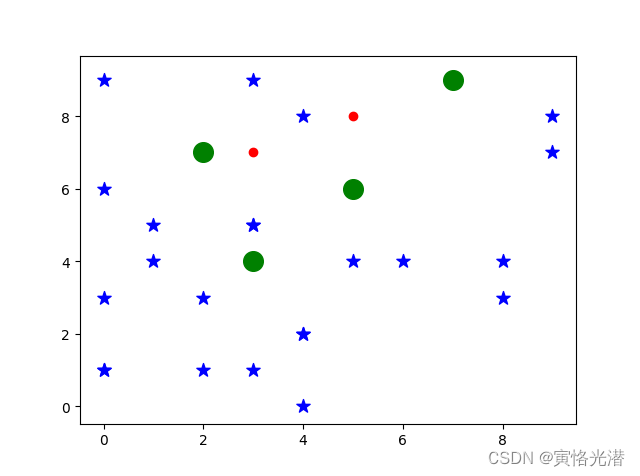
其中文档1.txt内容如下(上面图中的4个绿色大点)
5,6
7,9
3,4
2,7
来源地址:https://blog.csdn.net/weixin_41896770/article/details/126876059
--结束END--
本文标题: Python画图之散点图(plt.scatter)
本文链接: https://www.lsjlt.com/news/423904.html(转载时请注明来源链接)
有问题或投稿请发送至: 邮箱/279061341@qq.com QQ/279061341
下载Word文档到电脑,方便收藏和打印~
2024-03-01
2024-03-01
2024-03-01
2024-02-29
2024-02-29
2024-02-29
2024-02-29
2024-02-29
2024-02-29
2024-02-29
回答
回答
回答
回答
回答
回答
回答
回答
回答
回答


官方手机版

微信公众号

商务合作


0