本文介绍了如何在 PHP 中使用 pChart 创建图形。第一个是条形图,第二个是样条图,最后一个是来自 Mysql 的直方图。 设置你的环境 在使用 pChart 之前,你首先需要安装 ph
本文介绍了如何在 PHP 中使用 pChart 创建图形。第一个是条形图,第二个是样条图,最后一个是来自 Mysql 的直方图。
在使用 pChart 之前,你首先需要安装 php5。你可以从 SourceForge 获得 PHP5 作为 XAMPP 5.5.28 的一部分。
当你有 XAMPP 5.5.28 时,从他们的官方网站下载 pChart。之后,将 pChart 提取到 XAMPP 5.5.28 的 htdocs 文件夹中。
打开 pChart 文件夹,其结构应如下图所示:

注意:
class 文件夹包含我们将使用的类定义。fonts 文件夹包含我们可以在图表中使用的字体文件。
完成 pChart 设置后,你现在可以开始绘图了。
pChart 绘制条形图
使用 pChart 绘制条形图的 PHP 代码必须包含 class 文件夹中的三个文件。这些文件是:
pData.class.phppImage.class.phppDraw.class.php
在这些文件中,pData.class.php 允许你加载将在图表中使用的数据。你需要 pDraw.class.php 来绘制图表。
接下来,pImage.class.php 将让你在 WEB 浏览器中呈现图表。你必须使用 PHP required_once() 包含这些文件。
你可以使用相对路径包含它们或定义一个 PCART_PATH 常量。然后使用 set_include_path(),你可以为 pChart 类使用短目录名称。
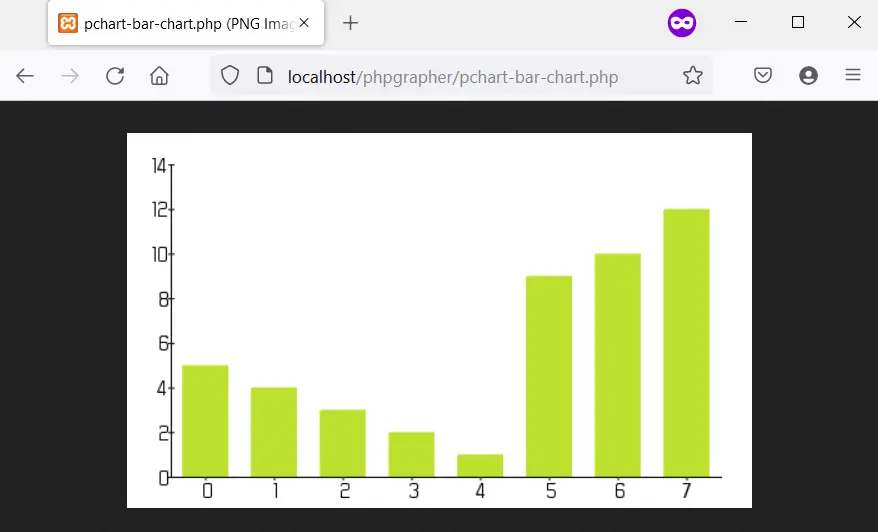
话虽如此,我们可以使用以下步骤创建带有 pChart 的条形图:
PCART_PATH 常量。set_include_path() 作为 pChart 类的短目录名称。required_once() 包含 pChart 类。pData 对象。addPoints 方法将数据添加到 pData 对象。pImage 对象为图表创建图像。pData 的 setGraphArea 方法设置图形区域。pData 的 drawScale 和 drawBarChart 方法绘制刻度和条形图。pData 的 Render 方法渲染图像。确保将 null 传递给 Render 方法。以下是这些步骤的实现。以下是 Firefox 101.0 中的输出图像。
<?php
    // The definition of the PCHART_PATH assumes
    // you have pChart one directory above your
    // current working folder.
    define("PCHART_PATH", "../pChart");
    set_include_path(get_include_path() . PATH_SEPARATOR . PCHART_PATH);
    // Since we have defined the path, and used
    // the get_include_path() function, we can
    // reference the class folder without writing
    // its full path.
    require_once "class/pDraw.class.php";
    require_once "class/pImage.class.php";
    require_once "class/pData.class.php";
    // Create the pChart Object
    $pchart_data = new pData();
    // Some sample data that we'll use to plot
    // the bar chart.
    $sample_data_set = [5, 4, 3, 2, 1, 9, 10, 12];
    $pchart_data->addPoints($sample_data_set);
    // Create the pChart Image. The first two argument
    // to the pImage object are the width and height
    // of the rendered chart.
    $pchart_image = new pImage(500, 300, $pchart_data);
    // Set the font.
    $pchart_image->setFontProperties(
    ["FontName" => PCHART_PATH . "/fonts/ForGotte.ttf",
    "FontSize" => 16]
    );
    // Define the graph area. The first two arguments
    // are the x-coordinates. While the last two are
    // the y-coordinates.
    $pchart_image->setGraphArea(35, 25, 475, 275);
    $pchart_image->drawScale();
    $pchart_image->drawBarChart();
    // Render the chart as a PNG image
    header("Content-Type: image/png");
    $pchart_image->Render(null);
?>
输出:
pChart 绘制样条图
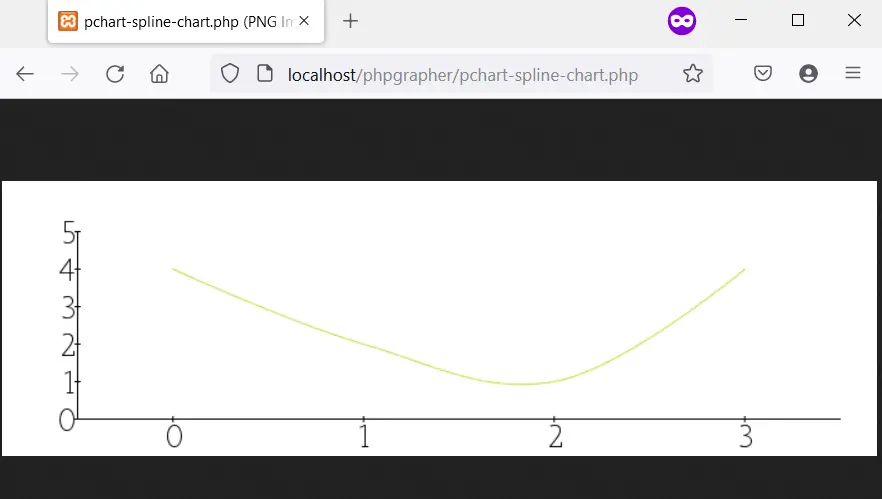
绘制样条图的过程与绘制条形图的过程相同,不同之处在于你使用 drawSplineChart 方法绘制样条图。此外,你可以选择不将图表作为图像发送。
相反,你可以选择 pData 的 Stroke 方法在 Web 浏览器中呈现图表。
以下代码使用 pChart 绘制样条图。此外,我们使用的是 fonts 目录中的 MankSans.ttf 字体。
<?php
    // The definition of the PCHART_PATH assumes
    // you have pChart one directory above your
    // current working folder.
    define("PCHART_PATH", "../pChart");
    set_include_path(get_include_path() . PATH_SEPARATOR . PCHART_PATH);
    // Since we have defined the path, and used
    // the get_include_path() function, we can
    // reference the class folder without writing
    // its full path.
    require_once "class/pDraw.class.php";
    require_once "class/pImage.class.php";
    require_once "class/pData.class.php";
    // Create the pChart Object
    $pchart_data = new pData();
    // Some sample data that we'll use to plot
    // the spline chart.
    $pchart_data->addPoints([4,2,1,4]);
    // Create the pChart Image. The first two argument
    // to the pImage object are the width and height
    // of the rendered chart.
    $pchart_image = new pImage(700, 220, $pchart_data);
    // Set the font.
    $pchart_image->setFontProperties(
        ["FontName" => PCHART_PATH . "/fonts/MankSans.ttf",
        "FontSize"=> 18]
    );
    // Define the graph area. The first two arguments
    // are the x-coordinates. While the last two are
    // the y-coordinates.
    $pchart_image->setGraphArea(60, 40, 670, 190);
    $pchart_image->drawScale();
    $pchart_image->drawSplineChart();
    // Draw the chart as a stroke.
    $pchart_image->Stroke();
?>
输出:
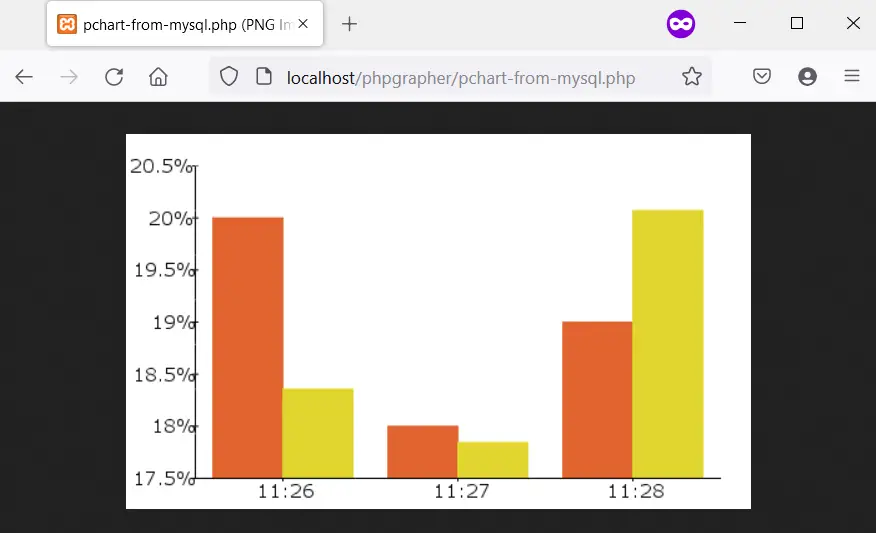
绘制直方图遵循与条形图和样条图类似的步骤。但是,有一些差异值得指出。
首先,直方图的数据将来自 Mysql。这意味着你应该有一个包含一些示例数据的数据库。
其次,你将使用表列名称作为直方图上的轴。为此,你将使用一些 pData 方法,例如 setAbscissa、setSeriesOnAxis 和 setAxisName。
现在,创建一个名为 weather_measurements 的数据库,然后使用以下命令创建一个表:
CREATE TABLE measures (
    timestamp INT NOT NULL DEFAULT '0',
    temperature INT NOT NULL,
    humidity INT NOT NULL
)
使用以下命令将样本数据插入 measures 表中:
INSERT INTO measures (timestamp, temperature, humidity) VALUES (UNIX_TIMESTAMP(), 20, 50);
INSERT INTO measures (timestamp, temperature, humidity) VALUES (UNIX_TIMESTAMP(), 18, 44);
INSERT INTO measures (timestamp, temperature, humidity) VALUES (UNIX_TIMESTAMP(), 19, 70);
确保样本数据在数据库中,然后使用以下命令创建直方图:
<?php
    // The definition of the PCHART_PATH assumes
    // you have pChart one directory above your
    // current working folder.
    define("PCHART_PATH", "../pChart");
    set_include_path(get_include_path() . PATH_SEPARATOR . PCHART_PATH);
    // Since we have defined the path, and used
    // the get_include_path() function, we can
    // reference the class folder without writing
    // its full path.
    require_once "class/pDraw.class.php";
    require_once "class/pImage.class.php";
    require_once "class/pData.class.php";
    // Create the pChart Object
    $pchart_data = new pData();

    // Connect to MySQL
    $connect_to_mysql = new mysqli("localhost", "root", "", "weather_measurements");

    // query the database and get the result
    $query_the_table = "SELECT * FROM measures";
    $mysql_result  = mysqli_query($connect_to_mysql, $query_the_table);
    // Declare the variables for the database
    // records as empty strings. Later, we'll
    // turn them into arrays for better perfORMance
    $timestamp = ""; $temperature = ""; $humidity = "";
    while($row = mysqli_fetch_array($mysql_result, MYSQLI_ASSOC)) {
        $timestamp[]   = $row["timestamp"];
        $temperature[] = $row["temperature"];
        $humidity[]    = $row["humidity"];
    }

    $pchart_data->addPoints($timestamp,"Timestamp");
    $pchart_data->addPoints($temperature,"Temperature");
    $pchart_data->addPoints($humidity,"Humidity");
    // Put the table column on the appropriate axis
    $pchart_data->setAbscissa("Timestamp");
    $pchart_data->setSerieOnAxis("Humidity", 1);
    $pchart_data->setXAxisName("Time");
    $pchart_data->setXAxisDisplay(AXIS_FORMAT_TIME,"H:i");
    // Dedicate the first and second axis to
    // Temperature and Humidity.
    $pchart_data->setAxisName(0, "Temperature");
    $pchart_data->setAxisUnit(0, "°C");
    $pchart_data->setAxisName(1, "Humidity");
    $pchart_data->setAxisUnit(0, "%");
    // Create the pChart Image. The first two argument
    // to the pImage object are the width and height
    // of the rendered chart.
    $pchart_image = new pImage(500, 300, $pchart_data);
    // Set the font.
    $pchart_image->setFontProperties(
        ["FontName" => PCHART_PATH . "/fonts/verdana.ttf",
        "FontSize"=> 11]
    );
    // Set the graph area.
    $pchart_image->setGraphArea(55,25, 475,275);
    $pchart_image->drawScale();
    $pchart_image->drawBarChart();
    // Draw the chart as a stroke.
    $pchart_image->Stroke();
?>
输出(你的时间会有所不同):
--结束END--
本文标题: 在 PHP 中绘制图形
本文链接: https://www.lsjlt.com/news/569103.html(转载时请注明来源链接)
有问题或投稿请发送至: 邮箱/279061341@qq.com QQ/279061341
2024-02-29
2024-02-29
2024-02-29
2024-02-29
2024-02-29
2024-02-29
2024-02-29
2024-02-29
2024-02-29
2024-02-29
回答
回答
回答
回答
回答
回答
回答
回答
回答
回答


官方手机版

微信公众号

商务合作

0