这篇文章主要讲解了“怎么解决oracle中由于gipc导致某节点crs无法启动问题”,文中的讲解内容简单清晰,易于学习与理解,下面请大家跟着小编的思路慢慢深入,一起来研究和学习“怎么解决oracle中由于g
这篇文章主要讲解了“怎么解决oracle中由于gipc导致某节点crs无法启动问题”,文中的讲解内容简单清晰,易于学习与理解,下面请大家跟着小编的思路慢慢深入,一起来研究和学习“怎么解决oracle中由于gipc导致某节点crs无法启动问题”吧!
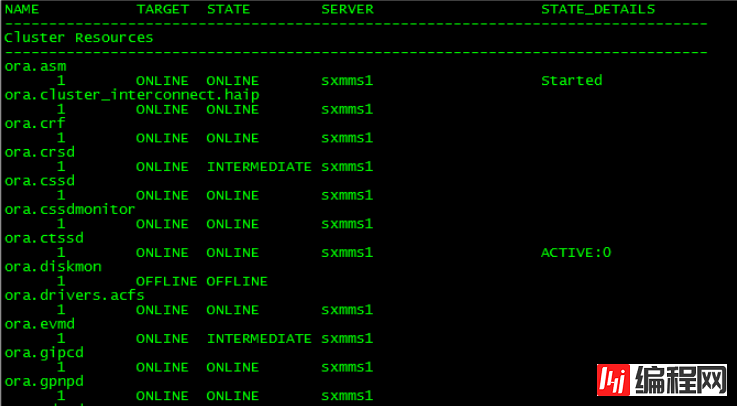
两节点RAC,其中1节点集群CRS无法启动。经过分析原因为2节点gipcd进程异常,导致节点之间无法正常通信,重启2节点gipcd.bin后问题得以恢复。从现象来看,是ora.crsd和ora.evmd无法启动,其他组件正常。
节点1集群日志13:08分时手动重启内容如下, 关于olsnodes.log无法删除的信息本环境中一直存在,此处信息可忽略。
2018-11-26 13:08:29.521: [client(892)]CRS-0009:log file "/home/u01/app/grid/11.2.0/product/log/sxmms1/client/olsnodes.log" reopened 2018-11-26 13:08:29.521: [client(892)]CRS-0019:file rotation terminated. log file: "/home/u01/app/grid/11.2.0/product/log/sxmms1/client/olsnodes.log" 2018-11-26 13:08:42.421: [ohasd(903)]CRS-2112:The OLR service started on node sxmms1. 2018-11-26 13:08:42.433: [ohasd(903)]CRS-1301:Oracle High Availability Service started on node sxmms1. 2018-11-26 13:08:42.433: [ohasd(903)]CRS-8017:location: /etc/oracle/lastgasp has 2 reboot advisory log files, 0 were announced and 0 errors occurred 2018-11-26 13:08:45.864: [/home/u01/app/grid/11.2.0/product/bin/orarootagent.bin(948)]CRS-2302:Cannot get GPnP profile. Error CLSGPNP_NO_DAEMON (GPNPD daemon is not running). 2018-11-26 13:08:51.238: [gpnpd(1118)]CRS-2328:GPNPD started on node sxmms1. 2018-11-26 13:08:53.710: [CSSd(1184)]CRS-1713:CSSD daemon is started in clustered mode 2018-11-26 13:08:55.508: [ohasd(903)]CRS-2767:Resource state recovery not attempted for 'ora.diskmon' as its target state is OFFLINE 2018-11-26 13:08:55.509: [ohasd(903)]CRS-2769:Unable to failover resource 'ora.diskmon'. 2018-11-26 13:09:03.406: [cssd(1184)]CRS-1707:Lease acquisition for node sxmms1 number 1 completed 2018-11-26 13:09:04.658: [cssd(1184)]CRS-1605:CSSD voting file is online: ORCL:OCR2; details in /home/u01/app/grid/11.2.0/product/log/sxmms1/cssd/ocssd.log. 2018-11-26 13:09:07.670: [cssd(1184)]CRS-1601:CSSD Reconfiguration complete. Active nodes are sxmms1 sxmms2 . 2018-11-26 13:09:09.989: [ctssd(1269)]CRS-2407:The new Cluster Time Synchronization Service reference node is host sxmms2. 2018-11-26 13:09:09.990: [ctssd(1269)]CRS-2401:The Cluster Time Synchronization Service started on host sxmms1. 2018-11-26 13:09:11.701: [ohasd(903)]CRS-2767:Resource state recovery not attempted for 'ora.diskmon' as its target state is OFFLINE 2018-11-26 13:09:11.701: [ohasd(903)]CRS-2769:Unable to failover resource 'ora.diskmon'. 2018-11-26 13:10:08.710: [/home/u01/app/grid/11.2.0/product/bin/orarootagent.bin(1129)]CRS-5818:Aborted command 'start' for resource 'ora.ctssd'. Details at (:CRSAGF00113:) {0:0:2} in /home/u01/app/grid/11.2.0/product/log/sxmms1/agent/ohasd/orarootagent_root/orarootagent_root.log. 2018-11-26 13:10:12.714: [ohasd(903)]CRS-2757:Command 'Start' timed out waiting for response from the resource 'ora.ctssd'. Details at (:CRSPE00111:) {0:0:2} in /home/u01/app/grid/11.2.0/product/log/sxmms1/ohasd/ohasd.log. [client(1584)]CRS-10001:26-Nov-18 13:10 ACFS-9391: Checking for existing ADVM/ACFS installation. [client(1589)]CRS-10001:26-Nov-18 13:10 ACFS-9392: Validating ADVM/ACFS installation files for operating system. [client(1591)]CRS-10001:26-Nov-18 13:10 ACFS-9393: Verifying ASM Administrator setup. [client(1594)]CRS-10001:26-Nov-18 13:10 ACFS-9308: Loading installed ADVM/ACFS drivers. [client(1597)]CRS-10001:26-Nov-18 13:10 ACFS-9154: Loading 'oracleoks.ko' driver. [client(1625)]CRS-10001:26-Nov-18 13:10 ACFS-9154: Loading 'oracleadvm.ko' driver. [client(1653)]CRS-10001:26-Nov-18 13:10 ACFS-9154: Loading 'oracleacfs.ko' driver. [client(1764)]CRS-10001:26-Nov-18 13:10 ACFS-9327: Verifying ADVM/ACFS devices. [client(1773)]CRS-10001:26-Nov-18 13:10 ACFS-9156: Detecting control device '/dev/asm/.asm_ctl_spec'. [client(1777)]CRS-10001:26-Nov-18 13:10 ACFS-9156: Detecting control device '/dev/ofsctl'. [client(1782)]CRS-10001:26-Nov-18 13:10 ACFS-9322: completed 2018-11-26 13:10:14.067: [ohasd(903)]CRS-2807:Resource 'ora.asm' failed to start automatically. 2018-11-26 13:10:14.067: [ohasd(903)]CRS-2807:Resource 'ora.crsd' failed to start automatically. 2018-11-26 13:10:14.067: [ohasd(903)]CRS-2807:Resource 'ora.evmd' failed to start automatically. 2018-11-26 13:11:42.738: [ohasd(903)]CRS-2765:Resource 'ora.ctssd' has failed on server 'sxmms1'. 2018-11-26 13:11:45.381: [ctssd(2151)]CRS-2407:The new Cluster Time Synchronization Service reference node is host sxmms2. 2018-11-26 13:11:45.382: [ctssd(2151)]CRS-2401:The Cluster Time Synchronization Service started on host sxmms1. |
日志只截取了部分内容,从日志来看,几乎很多组件在启动时都出现了超时
/home/u01/app/grid/11.2.0/product/log/sxmms1/agent/ohasd/orarootagent_root/orarootagent_root.log
2018-11-26 13:10:06.792: [ora.ctssd][2525660928]{0:0:2} [start] clsdmc_respget return: status=0, ecode=0, returnbuf=[0x7f51780ce0c0], buflen=8 2018-11-26 13:10:06.792: [ora.ctssd][2525660928]{0:0:2} [start] Start: Extended check return buffer: "? with length of 8 2018-11-26 13:10:06.792: [ora.ctssd][2525660928]{0:0:2} [start] translateReturnCodes, return = 0, state detail = Checkcb data [0x7f51780ce0c0]: mode[0xc0] offset[0 ms]. [ clsdmc][2525660928]CLSDMC.C returnbuflen=8, extraDataBuf=C0, returnbuf=7805FCE0 2018-11-26 13:10:07.793: [ora.ctssd][2525660928]{0:0:2} [start] clsdmc_respget return: status=0, ecode=0, returnbuf=[0x7f517805fce0], buflen=8 2018-11-26 13:10:07.793: [ora.ctssd][2525660928]{0:0:2} [start] Start: Extended check return buffer: "? with length of 8 2018-11-26 13:10:07.793: [ora.ctssd][2525660928]{0:0:2} [start] translateReturnCodes, return = 0, state detail = Checkcb data [0x7f517805fce0]: mode[0xc0] offset[0 ms]. 2018-11-26 13:10:08.710: [ AGENT][2527762176]{0:0:2} {0:0:2} Created alert : (:CRSAGF00113:) : Aborting the command: start for resource: ora.ctssd 1 1 2018-11-26 13:10:08.710: [ora.ctssd][2527762176]{0:0:2} [start] (:CLSN00110:) clsn_agent::abort { 2018-11-26 13:10:08.710: [ora.ctssd][2527762176]{0:0:2} [start] abort { 2018-11-26 13:10:08.710: [ora.ctssd][2527762176]{0:0:2} [start] Agent::abort last call info: "Agent::Agent refreshAttr" 2018-11-26 13:10:08.710: [ora.ctssd][2527762176]{0:0:2} [start] abort command: start 2018-11-26 13:10:08.710: [ora.ctssd][2527762176]{0:0:2} [start] tryActionLock { [ clsdmc][2525660928]CLSDMC.C returnbuflen=8, extraDataBuf=C0, returnbuf=780CE0C0 2018-11-26 13:10:08.795: [ora.ctssd][2525660928]{0:0:2} [start] clsdmc_respget return: status=0, ecode=0, returnbuf=[0x7f51780ce0c0], buflen=8 2018-11-26 13:10:08.795: [ora.ctssd][2525660928]{0:0:2} [start] Start: Extended check return buffer: "? with length of 8 2018-11-26 13:10:08.795: [ora.ctssd][2525660928]{0:0:2} [start] translateReturnCodes, return = 0, state detail = Checkcb data [0x7f51780ce0c0]: mode[0xc0] offset[0 ms]. 2018-11-26 13:10:08.795: [ora.ctssd][2525660928]{0:0:2} [start] Start action aborted 2018-11-26 13:10:08.796: [ora.ctssd][2525660928]{0:0:2} [start] clsnUtils::error Exception type=2 string= CRS-5017: The resource action "ora.ctssd start" encountered the following error: Start action for octssd aborted. For details refer to "(:CLSN00107:)" in "/home/u01/app/grid/11.2.0/product/log/sxmms1/agent/ohasd/orarootagent_root/orarootagent_root.log".
2018-11-26 13:10:08.796: [ AGFW][2525660928]{0:0:2} sending status msg [CRS-5017: The resource action "ora.ctssd start" encountered the following error: Start action for octssd aborted. For details refer to "(:CLSN00107:)" in "/home/u01/app/grid/11.2.0/product/log/sxmms1/agent/ohasd/orarootagent_root/orarootagent_root.log". ] for start for resource: ora.ctssd 1 1 2018-11-26 13:10:08.796: [ora.ctssd][2525660928]{0:0:2} [start] (:CLSN00107:) clsn_agent::start } 2018-11-26 13:10:08.797: [ AGFW][2523559680]{0:0:2} Agent sending reply for: RESOURCE_START[ora.ctssd 1 1] ID 4098:361 2018-11-26 13:10:12.711: [ora.ctssd][2527762176]{0:0:2} [start] Got lock 2018-11-26 13:10:12.711: [ora.ctssd][2527762176]{0:0:2} [start] tryActionLock } 2018-11-26 13:10:12.711: [ora.ctssd][2527762176]{0:0:2} [start] abort } 2018-11-26 13:10:12.711: [ora.ctssd][2527762176]{0:0:2} [start] (:CLSN00110:) clsn_agent::abort } 2018-11-26 13:10:12.711: [ AGFW][2527762176]{0:0:2} Command: start for resource: ora.ctssd 1 1 completed with status: TIMEDOUT 2018-11-26 13:10:12.712: [ AGFW][2523559680]{0:0:2} Agent sending reply for: RESOURCE_START[ora.ctssd 1 1] ID 4098:361 [ clsdmc][2527762176]CLSDMC.C returnbuflen=8, extraDataBuf=C0, returnbuf=84006B40
|
CRSD日志看到异常信息,但并未有特别的指向具体是哪里出现问题导致无法启动。
2018-11-26 13:03:59.877: [ CRSMAIN][3661960960] Policy Engine is not initialized yet! 2018-11-26 13:04:29.881: [ CRSMAIN][3661960960] Policy Engine is not initialized yet! 2018-11-26 13:04:59.886: [ CRSMAIN][3661960960] Policy Engine is not initialized yet! 2018-11-26 13:05:29.890: [ CRSMAIN][3661960960] Policy Engine is not initialized yet! 2018-11-26 13:05:59.895: [ CRSMAIN][3661960960] Policy Engine is not initialized yet! 2018-11-26 13:06:29.897: [ CRSMAIN][3661960960] Policy Engine is not initialized yet! 2018-11-26 13:11:55.357: [ CRSMAIN][3963266848] First attempt: init CSS context succeeded. [ clsdmt][3956815616]Listening to (ADDRESS=(PROTOCOL=ipc)(KEY=sxmms1DBG_CRSD)) 2018-11-26 13:11:55.361: [ clsdmt][3956815616]PID for the Process [2324], connkey 1 2018-11-26 13:11:55.361: [ clsdmt][3956815616]Creating PID [2324] file for home /home/u01/app/grid/11.2.0/product host sxmms1 bin crs to /home/u01/app/grid/11.2.0/product/crs/init/ 2018-11-26 13:11:55.362: [ clsdmt][3956815616]Writing PID [2324] to the file [/home/u01/app/grid/11.2.0/product/crs/init/sxmms1.pid] 2018-11-26 13:11:56.304: [ CRSMAIN][3956815616] Policy Engine is not initialized yet! 2018-11-26 13:11:56.304: [ CRSMAIN][3963266848] CRS Daemon Starting 2018-11-26 13:11:56.305: [ CRSD][3963266848] Logging level for Module: allcomp 0 2018-11-26 13:11:56.305: [ CRSD][3963266848] Logging level for Module: default 0 2018-11-26 13:11:56.305: [ CRSD][3963266848] Logging level for Module: COMMCRS 0 2018-11-26 13:11:56.305: [ CRSD][3963266848] Logging level for Module: COMMNS 0 2018-11-26 13:11:56.305: [ CRSD][3963266848] Logging level for Module: CSSCLNT 0 2018-11-26 13:11:56.305: [ CRSD][3963266848] Logging level for Module: GIPCLIB 0 2018-11-26 13:11:56.305: [ CRSD][3963266848] Logging level for Module: GIPCXBAD 0 2018-11-26 13:11:56.305: [ CRSD][3963266848] Logging level for Module: GIPCLXPT 0 2018-11-26 13:11:56.305: [ CRSD][3963266848] Logging level for Module: GIPCUNDE 0 2018-11-26 13:11:56.305: [ CRSD][3963266848] Logging level for Module: GIPC 0 |
evmd日志为早上无法启动时的信息,但后续内容一致,所以时间09:51的错误信息也可用来分析;日志显示CRS无法启动,gipc连接超时,由于另外节点都正常,所以排除OCR出现问题。
2018-11-26 09:51:56.086: [ OCRMSG][2406381344]prom_connect: error while waiting for connection complete [24] 2018-11-26 09:51:56.086: [ CRSOCR][2406381344] OCR context init failure. Error: PROC-32: Cluster Ready Services on the local node is not running Messaging error [gipcretConnectionRefused] [29] 2018-11-26 09:51:57.088: [ OCRMSG][2406381344]prom_waitconnect: CONN NOT ESTABLISHED (0,29,1,2) 2018-11-26 09:51:57.088: [ OCRMSG][2406381344]GIPC error [29] msg [gipcretConnectionRefused] 2018-11-26 09:51:57.088: [ OCRMSG][2406381344]prom_connect: error while waiting for connection complete [24] 2018-11-26 09:51:57.088: [ CRSOCR][2406381344] OCR context init failure. Error: PROC-32: Cluster Ready Services on the local node is not running Messaging error [gipcretConnectionRefused] [29] 2018-11-26 09:51:58.089: [ OCRMSG][2406381344]prom_waitconnect: CONN NOT ESTABLISHED (0,29,1,2) 2018-11-26 09:51:58.089: [ OCRMSG][2406381344]GIPC error [29] msg [gipcretConnectionRefused] 2018-11-26 09:51:58.089: [ OCRMSG][2406381344]prom_connect: error while waiting for connection complete [24] 2018-11-26 09:51:58.089: [ CRSOCR][2406381344] OCR context init failure. Error: PROC-32: Cluster Ready Services on the local node is not running Messaging error [gipcretConnectionRefused] [29] |
分析gipc日志发现,在检测与2节点之间连接时发生超时,最终导致连接无法建立,gipc是RAC集群中负责私网的连接建立,当建立连接出现问题时就需要进一步分析。
2018-11-26 13:05:27.553: [GIPCDCLT][2946344704] gipcdClientThread: req from local client of type gipcdmsgtypeInterfaceMetrics, endp 0000000000001a67 2018-11-26 13:05:28.954: [GIPCDCLT][2946344704] gipcdClientThread: req from local client of type gipcdmsgtypeInterfaceMetrics, endp 0000000000000348 2018-11-26 13:05:29.108: [GIPCDCLT][2946344704] gipcdClientThread: req from local client of type gipcdmsgtypeInterfaceMetrics, endp 0000000000000723 2018-11-26 13:05:29.109: [GIPCDMON][2818569984] gipcdMonitorCssCheck: found node sxmms1 2018-11-26 13:05:29.110: [GIPCDMON][2818569984] gipcdMonitorCssCheck: found node sxmms2 2018-11-26 13:05:29.110: [GIPCDMON][2818569984] gipcdMonitorCssCheck: updating timeout node sxmms2 2018-11-26 13:05:29.110: [GIPCDMON][2818569984] gipcdMonitorFailZombieNodes: skipping live node 'sxmms2', time 0 ms, endp 0000000000000000, 00000000000007ba 2018-11-26 13:05:30.624: [ CLSINET][2818569984] Returning NETDATA: 1 interfaces 2018-11-26 13:05:30.624: [ CLSINET][2818569984] # 0 Interface 'eth3',ip='192.168.0.1',Mac='a0-36-9f-5d-5c-54',mask='255.255.255.0',net='192.168.0.0',use='cluster_interconnect' 2018-11-26 13:05:31.960: [GIPCDCLT][2946344704] gipcdClientThread: req from local client of type gipcdmsgtypeInterfaceMetrics, endp 000000000000032d 2018-11-26 13:05:32.478: [GIPCDCLT][2946344704] gipcdClientThread: req from local client of type gipcdmsgtypeInterfaceMetrics, endp 0000000000000121 2018-11-26 13:05:32.559: [GIPCDCLT][2946344704] gipcdClientThread: req from local client of type gipcdmsgtypeInterfaceMetrics, endp 0000000000001a67 2018-11-26 13:05:33.550: [GIPCDMON][2818569984] gipcdMonitorSaveInfMetrics: inf[ 0] eth3 - rank 99, avgms 1.111111 [ 151 / 117 / 117 ] 2018-11-26 13:05:33.964: [GIPCDCLT][2946344704] gipcdClientThread: req from local client of type gipcdmsgtypeInterfaceMetrics, endp 0000000000000348 2018-11-26 13:05:34.114: [GIPCDCLT][2946344704] gipcdClientThread: req from local client of type gipcdmsgtypeInterfaceMetrics, endp 0000000000000723 2018-11-26 13:05:34.115: [GIPCDMON][2818569984] gipcdMonitorCssCheck: found node sxmms1 2018-11-26 13:05:34.116: [GIPCDMON][2818569984] gipcdMonitorCssCheck: found node sxmms2 2018-11-26 13:05:34.116: [GIPCDMON][2818569984] gipcdMonitorCssCheck: updating timeout node sxmms2 2018-11-26 13:05:34.116: [GIPCDMON][2818569984] gipcdMonitorFailZombieNodes: skipping live node 'sxmms2', time 0 ms, endp 0000000000000000, 00000000000007ba 2018-11-26 13:05:35.646: [ CLSINET][2818569984] Returning NETDATA: 1 interfaces 2018-11-26 13:05:35.646: [ CLSINET][2818569984] # 0 Interface 'eth3',ip='192.168.0.1',mac='a0-36-9f-5d-5c-54',mask='255.255.255.0',net='192.168.0.0',use='cluster_interconnect' 2018-11-26 13:05:36.971: [GIPCDCLT][2946344704] gipcdClientThread: req from local client of type gipcdmsgtypeInterfaceMetrics, endp 000000000000032d 2018-11-26 13:05:37.480: [GIPCDCLT][2946344704] gipcdClientThread: req from local client of type gipcdmsgtypeInterfaceMetrics, endp 0000000000000121 2018-11-26 13:05:37.565: [GIPCDCLT][2946344704] gipcdClientThread: req from local client of type gipcdmsgtypeInterfaceMetrics, endp 0000000000001a67 2018-11-26 13:05:38.975: [GIPCDCLT][2946344704] gipcdClientThread: req from local client of type gipcdmsgtypeInterfaceMetrics, endp 0000000000000348 2018-11-26 13:05:39.120: [GIPCDCLT][2946344704] gipcdClientThread: req from local client of type gipcdmsgtypeInterfaceMetrics, endp 0000000000000723 2018-11-26 13:05:39.121: [GIPCDMON][2818569984] gipcdMonitorCssCheck: found node sxmms1 2018-11-26 13:05:39.122: [GIPCDMON][2818569984] gipcdMonitorCssCheck: found node sxmms2 2018-11-26 13:05:39.122: [GIPCDMON][2818569984] gipcdMonitorCssCheck: updating timeout node sxmms2 2018-11-26 13:05:39.122: [GIPCDMON][2818569984] gipcdMonitorFailZombieNodes: skipping live node 'sxmms2', time 0 ms, endp 0000000000000000, 00000000000007ba 2018-11-26 13:05:40.626: [ CLSINET][2818569984] Returning NETDATA: 1 interfaces 2018-11-26 13:05:40.626: [ CLSINET][2818569984] # 0 Interface 'eth3',ip='192.168.0.1',mac='a0-36-9f-5d-5c-54',mask='255.255.255.0',net='192.168.0.0',use='cluster_interconnect' 2018-11-26 13:05:41.982: [GIPCDCLT][2946344704] gipcdClientThread: req from local client of type gipcdmsgtypeInterfaceMetrics, endp 000000000000032d 2018-11-26 13:05:42.482: [GIPCDCLT][2946344704] gipcdClientThread: req from local client of type gipcdmsgtypeInterfaceMetrics, endp 0000000000000121 2018-11-26 13:05:42.572: [GIPCDCLT][2946344704] gipcdClientThread: req from local client of type gipcdmsgtypeInterfaceMetrics, endp 0000000000001a67 2018-11-26 13:05:43.986: [GIPCDCLT][2946344704] gipcdClientThread: req from local client of type gipcdmsgtypeInterfaceMetrics, endp 0000000000000348 2018-11-26 13:05:44.127: [GIPCDCLT][2946344704] gipcdClientThread: req from local client of type gipcdmsgtypeInterfaceMetrics, endp 0000000000000723 2018-11-26 13:05:44.128: [GIPCDMON][2818569984] gipcdMonitorCssCheck: found node sxmms1 2018-11-26 13:05:44.128: [GIPCDMON][2818569984] gipcdMonitorCssCheck: found node sxmms2 2018-11-26 13:05:44.128: [GIPCDMON][2818569984] gipcdMonitorCssCheck: updating timeout node sxmms2 2018-11-26 13:05:44.128: [GIPCDMON][2818569984] gipcdMonitorFailZombieNodes: skipping live node 'sxmms2', time 0 ms, endp 0000000000000000, 00000000000007ba 2018-11-26 13:05:45.632: [ CLSINET][2818569984] Returning NETDATA: 1 interfaces 2018-11-26 13:05:45.632: [ CLSINET][2818569984] # 0 Interface 'eth3',ip='192.168.0.1',mac='a0-36-9f-5d-5c-54',mask='255.255.255.0',net='192.168.0.0',use='cluster_interconnect' 2018-11-26 13:05:46.992: [GIPCDCLT][2946344704] gipcdClientThread: req from local client of type gipcdmsgtypeInterfaceMetrics, endp 000000000000032d 2018-11-26 13:05:47.485: [GIPCDCLT][2946344704] gipcdClientThread: req from local client of type gipcdmsgtypeInterfaceMetrics, endp 0000000000000121 2018-11-26 13:05:47.578: [GIPCDCLT][2946344704] gipcdClientThread: req from local client of type gipcdmsgtypeInterfaceMetrics, endp 0000000000001a67 2018-11-26 13:05:48.997: [GIPCDCLT][2946344704] gipcdClientThread: req from local client of type gipcdmsgtypeInterfaceMetrics, endp 0000000000000348 2018-11-26 13:05:48.997: [GIPCDCLT][2946344704] gipcdClientInterfaceMetrics: Received type(gipcdmsgtypeInterfaceMetrics), endp(0000000000000348), len(1032), buf(0x7f7ca0254448), inf(ip: 192.168.0.1:14459, mask: 255.255.255.0, subnet: 192.168.0.0, mac: , ifname: ) time(0), retry(0), stamp(0), send(0), recv(0) 2018-11-26 13:05:48.997: [GIPCDCLT][2946344704] gipcdClientInterfaceMetrics: enqueue local interface metrics (1) to worklist 2018-11-26 13:05:49.133: [GIPCDCLT][2946344704] gipcdClientThread: req from local client of type gipcdmsgtypeInterfaceMetrics, endp 0000000000000723 2018-11-26 13:05:49.133: [GIPCDCLT][2946344704] gipcdClientInterfaceMetrics: Received type(gipcdmsgtypeInterfaceMetrics), endp(0000000000000723), len(1032), buf(0x7f7ca0254448), inf(ip: 192.168.0.1:29489, mask: 255.255.255.0, subnet: 192.168.0.0, mac: , ifname: ) time(0), retry(0), stamp(0), send(0), recv(0) 2018-11-26 13:05:49.133: [GIPCDCLT][2946344704] gipcdClientInterfaceMetrics: enqueue local interface metrics (1) to worklist 2018-11-26 13:05:49.134: [GIPCDMON][2818569984] gipcdMonitorCssCheck: found node sxmms1 2018-11-26 13:05:49.134: [GIPCDMON][2818569984] gipcdMonitorCssCheck: found node sxmms2 2018-11-26 13:05:49.135: [GIPCDMON][2818569984] gipcdMonitorCssCheck: updating timeout node sxmms2 |
通过以上分析,一些资源无法启动皆是gipc建立建立超时导致,而私网出现问题可分为几种情况
1、os层面网卡、网络配置、路由、网络交换机等出现问题;
2、iptable、selinux等出现异常;
2、两个节点gipc至少有一个进程存在异常;
通过1节点系统日志massage、netstat、iptables、selinux等方面的检查,确认系统层面网络无异常,私网也可以ping通,其他通过集群状态也可间接判断,因为1节点cssd服务正常,基本可以确认私网的连通性是正常的,而1节点的gipc日志中eht2网卡的rank值为99,也表名网卡状态正常,排除1节点的网卡和gipc后,需要查看2节点来进一步判断。
节点2集群ALERT日志分析,13:08分节点1重启期间,节点2的gipc、evmd和ctss服务也出现了异常
2018-11-26 13:00:40.747: [/home/u01/app/grid/11.2.0/product/bin/orarootagent.bin(6098)]CRS-5018:(:CLSN00037:) Removed unused HAIP route: 169.254.95.0 / 255.255.255.0 / 0.0.0.0 / usb0 2018-11-26 13:06:57.926: [cssd(15973)]CRS-1625:Node sxmms1, number 1, was manually shut down 2018-11-26 13:06:57.944: [cssd(15973)]CRS-1601:CSSD Reconfiguration complete. Active nodes are sxmms2 . 2018-11-26 13:09:08.318: [cssd(15973)]CRS-1601:CSSD Reconfiguration complete. Active nodes are sxmms1 sxmms2 . 2018-11-26 13:10:46.812: [/home/u01/app/grid/11.2.0/product/bin/orarootagent.bin(6098)]CRS-5018:(:CLSN00037:) Removed unused HAIP route: 169.254.95.0 / 255.255.255.0 / 0.0.0.0 / usb0 2018-11-26 13:20:52.862: [/home/u01/app/grid/11.2.0/product/bin/orarootagent.bin(6098)]CRS-5018:(:CLSN00037:) Removed unused HAIP route: 169.254.95.0 / 255.255.255.0 / 0.0.0.0 / usb0 2018-11-26 13:31:02.879: [/home/u01/app/grid/11.2.0/product/bin/orarootagent.bin(6098)]CRS-5018:(:CLSN00037:) Removed unused HAIP route: 169.254.95.0 / 255.255.255.0 / 0.0.0.0 / usb0 2018-11-26 13:41:12.924: [/home/u01/app/grid/11.2.0/product/bin/orarootagent.bin(6098)]CRS-5018:(:CLSN00037:) Removed unused HAIP route: 169.254.95.0 / 255.255.255.0 / 0.0.0.0 / usb0 2018-11-26 13:51:20.976: [/home/u01/app/grid/11.2.0/product/bin/orarootagent.bin(6098)]CRS-5018:(:CLSN00037:) Removed unused HAIP route: 169.254.95.0 / 255.255.255.0 / 0.0.0.0 / usb0 2018-11-26 14:01:33.018: [/home/u01/app/grid/11.2.0/product/bin/orarootagent.bin(6098)]CRS-5018:(:CLSN00037:) Removed unused HAIP route: 169.254.95.0 / 255.255.255.0 / 0.0.0.0 / usb0 2018-11-26 14:11:45.027: [/home/u01/app/grid/11.2.0/product/bin/orarootagent.bin(6098)]CRS-5018:(:CLSN00037:) Removed unused HAIP route: 169.254.95.0 / 255.255.255.0 / 0.0.0.0 / usb0 2018-11-26 14:20:10.218: [ohasd(5572)]CRS-2765:Resource 'ora.gipcd' has failed on server 'sxmms2'. 2018-11-26 14:20:10.287: [ohasd(5572)]CRS-2765:Resource 'ora.ctssd' has failed on server 'sxmms2'. 2018-11-26 14:20:10.870: [ohasd(5572)]CRS-2765:Resource 'ora.evmd' has failed on server 'sxmms2'. 2018-11-26 14:20:11.060: [/home/u01/app/grid/11.2.0/product/bin/scriptagent.bin(52396)]CRS-5822:Agent '/home/u01/app/grid/11.2.0/product/bin/scriptagent_grid' disconnected from server. Details at (:CRSAGF00117:) {0:11:97} in /home/u01/app/grid/11.2.0/product/log/sxmms2/agent/crsd/scriptagent_grid/scriptagent_grid.log. 2018-11-26 14:20:11.060: |
分析日志发现,rank值出现过0的情况,并且drop信息出现超时,同时2节点的系统日志、网卡以及netstat等信息无异常,至此已基本可以确认2节点的gipc进程异常导致的两节点间无法建立连接。
2018-11-26 13:07:41.526: [GIPCDMON][4093638400] gipcdMonitorCssCheck: found node sxmms2 2018-11-26 13:07:41.526: [GIPCDMON][4093638400] gipcdMonitorFailZombieNodes: skipping live node 'sxmms1', time 737498576 ms, endp 0000000000000000, 00000000470e5359 2018-11-26 13:07:41.537: [GIPCDCLT][4166940416] gipcdClientThread: req from local client of type gipcdmsgtypeInterfaceMetrics, endp 0000000000000355 2018-11-26 13:07:42.226: [GIPCDCLT][4166940416] gipcdClientThread: req from local client of type gipcdmsgtypeInterfaceMetrics, endp 0000000011befdfb 2018-11-26 13:07:42.384: [ CLSINET][4093638400] Returning NETDATA: 1 interfaces 2018-11-26 13:07:42.384: [ CLSINET][4093638400] # 0 Interface 'eth3',ip='192.168.0.2',mac='a0-36-9f-5d-66-ec',mask='255.255.255.0',net='192.168.0.0',use='cluster_interconnect' 2018-11-26 13:07:43.840: [GIPCDCLT][4166940416] gipcdClientThread: req from local client of type gipcdmsgtypeInterfaceMetrics, endp 0000000000000370 2018-11-26 13:07:44.077: [GIPCDCLT][4166940416] gipcdClientThread: req from local client of type gipcdmsgtypeInterfaceMetrics, endp 0000000011bf00f6 2018-11-26 13:07:44.888: [GIPCDMON][4093638400] gipcdMonitorSaveInfMetrics: inf[ 0] eth3 - rank 0, avgms 30000000000.000000 [ 16 / 0 / 0 ] 2018-11-26 13:07:44.888: [GIPCDMON][4093638400] gipcdMonitorSaveInfMetrics: saving: eth3:0 2018-11-26 13:07:45.542: [GIPCHALO][4091537152] gipchaLowerProcessNode: no valid interfaces found to node for 737502596 ms, node 0x7f00d022b420 { host 'sxmms1', haName 'gipcd_ha_name', srcLuid 3De74e37-09e82f35, dstLuid 50a77767-85458162 numInf 1, contigSeq 0, lastAck 0, lastValidAck 0, sendSeq [11888 : 11888], createTime 725590486, sentReGISter 1, localMonitor 1, flags 0x4 } 2018-11-26 13:07:45.812: [GIPCDCLT][4166940416] gipcdClientThread: req from local client of type gipcdmsgtypeInterfaceMetrics, endp 0000000000000ca1 2018-11-26 13:07:46.529: [GIPCDCLT][4166940416] gipcdClientThread: req from local client of type gipcdmsgtypeInterfaceMetrics, endp 0000000011befc2f 2018-11-26 13:07:46.531: [GIPCDMON][4093638400] gipcdMonitorCssCheck: found node sxmms2 2018-11-26 13:07:46.531: [GIPCDMON][4093638400] gipcdMonitorFailZombieNodes: skipping live node 'sxmms1', time 737503586 ms, endp 0000000000000000, 00000000470e5359 2018-11-26 13:07:46.544: [GIPCDCLT][4166940416] gipcdClientThread: req from local client of type gipcdmsgtypeInterfaceMetrics, endp 0000000000000355 2018-11-26 13:07:47.232: [GIPCDCLT][4166940416] gipcdClientThread: req from local client of type gipcdmsgtypeInterfaceMetrics, endp 0000000011befdfb 2018-11-26 13:07:47.232: [GIPCDCLT][4166940416] gipcdClientInterfaceMetrics: Received type(gipcdmsgtypeInterfaceMetrics), endp(0000000011befdfb), len(1032), buf(0x7f00e82872e8), inf(ip: 192.168.0.2:39280, mask: 255.255.255.0, subnet: 192.168.0.0, mac: , ifname: ) time(0), retry(0), stamp(0), send(0), recv(0) 2018-11-26 13:07:47.232: [GIPCDCLT][4166940416] gipcdClientInterfaceMetrics: enqueue local interface metrics (1) to worklist 2018-11-26 13:07:47.380: [ CLSINET][4093638400] Returning NETDATA: 1 interfaces 2018-11-26 13:07:47.380: [ CLSINET][4093638400] # 0 Interface 'eth3',ip='192.168.0.2',mac='a0-36-9f-5d-66-ec',mask='255.255.255.0',net='192.168.0.0',use='cluster_interconnect' 2018-11-26 13:07:48.846: [GIPCDCLT][4166940416] gipcdClientThread: req from local client of type gipcdmsgtypeInterfaceMetrics, endp 0000000000000370 2018-11-26 13:07:49.083: [GIPCDCLT][4166940416] gipcdClientThread: req from local client of type gipcdmsgtypeInterfaceMetrics, endp 0000000011bf00f6 2018-11-26 13:07:50.813: [GIPCDCLT][4166940416] gipcdClientThread: req from local client of type gipcdmsgtypeInterfaceMetrics, endp 0000000000000ca1 2018-11-26 13:07:51.534: [GIPCDCLT][4166940416] gipcdClientThread: req from local client of type gipcdmsgtypeInterfaceMetrics, endp 0000000011befc2f 2018-11-26 13:07:51.536: [GIPCDMON][4093638400] gipcdMonitorCssCheck: found node sxmms2 2018-11-26 13:07:51.536: [GIPCDMON][4093638400] gipcdMonitorFailZombieNodes: skipping live node 'sxmms1', time 737508586 ms, endp 0000000000000000, 00000000470e5359 2018-11-26 13:07:51.550: [GIPCHALO][4091537152] gipchaLowerProcessNode: no valid interfaces found to node for 737508606 ms, node 0x7f00d022b420 { host 'sxmms1', haName 'gipcd_ha_name', srcLuid 3de74e37-09e82f35, dstLuid 50a77767-85458162 numInf 1, contigSeq 0, lastAck 0, lastValidAck 0, sendSeq [11894 : 11894], createTime 725590486, sentRegister 1, localMonitor 1, flags 0x4 } 2018-11-26 13:07:51.550: [GIPCDCLT][4166940416] gipcdClientThread: req from local client of type gipcdmsgtypeInterfaceMetrics, endp 0000000000000355 2018-11-26 13:07:52.237: [GIPCDCLT][4166940416] gipcdClientThread: req from local client of type gipcdmsgtypeInterfaceMetrics, endp 0000000011befdfb 2018-11-26 13:07:52.386: [ CLSINET][4093638400] Returning NETDATA: 1 interfaces 2018-11-26 13:07:52.386: [ CLSINET][4093638400] # 0 Interface 'eth3',ip='192.168.0.2',mac='a0-36-9f-5d-66-ec',mask='255.255.255.0',net='192.168.0.0',use='cluster_interconnect' 2018-11-26 13:07:53.852: [GIPCDCLT][4166940416] gipcdClientThread: req from local client of type gipcdmsgtypeInterfaceMetrics, endp 0000000000000370 2018-11-26 13:07:54.089: [GIPCDCLT][4166940416] gipcdClientThread: req from local client of type gipcdmsgtypeInterfaceMetrics, endp 0000000011bf00f6 2018-11-26 13:07:55.815: [GIPCDCLT][4166940416] gipcdClientThread: req from local client of type gipcdmsgtypeInterfaceMetrics, endp 0000000000000ca1 2018-11-26 13:07:56.540: [GIPCDCLT][4166940416] gipcdClientThread: req from local client of type gipcdmsgtypeInterfaceMetrics, endp 0000000011befc2f 2018-11-26 13:07:56.541: [GIPCDMON][4093638400] gipcdMonitorCssCheck: found node sxmms2 2018-11-26 13:07:56.541: [GIPCDMON][4093638400] gipcdMonitorFailZombieNodes: skipping live node 'sxmms1', time 737513596 ms, endp 0000000000000000, 00000000470e5359 2018-11-26 13:07:56.556: [GIPCDCLT][4166940416] gipcdClientThread: req from local client of type gipcdmsgtypeInterfaceMetrics, endp 0000000000000355 2018-11-26 13:07:57.243: [GIPCDCLT][4166940416] gipcdClientThread: req from local client of type gipcdmsgtypeInterfaceMetrics, endp 0000000011befdfb 2018-11-26 13:07:57.381: [ CLSINET][4093638400] Returning NETDATA: 1 interfaces 2018-11-26 13:07:57.381: [ CLSINET][4093638400] # 0 Interface 'eth3',ip='192.168.0.2',mac='a0-36-9f-5d-66-ec',mask='255.255.255.0',net='192.168.0.0',use='cluster_interconnect' 2018-11-26 13:07:57.556: [GIPCHALO][4091537152] gipchaLowerProcessNode: no valid interfaces found to node for 737514606 ms, node 0x7f00d022b420 { host 'sxmms1', haName 'gipcd_ha_name', srcLuid 3de74e37-09e82f35, dstLuid 50a77767-85458162 numInf 1, contigSeq 0, lastAck 0, lastValidAck 0, sendSeq [11900 : 11900], createTime 725590486, sentRegister 1, localMonitor 1, flags 0x4 } 2018-11-26 13:07:58.856: [GIPCDCLT][4166940416] gipcdClientThread: req from local client of type gipcdmsgtypeInterfaceMetrics, endp 0000000000000370 2018-11-26 13:07:59.095: [GIPCDCLT][4166940416] gipcdClientThread: req from local client of type gipcdmsgtypeInterfaceMetrics, endp 0000000011bf00f6 2018-11-26 13:08:00.816: [GIPCDCLT][4166940416] gipcdClientThread: req from local client of type gipcdmsgtypeInterfaceMetrics, endp 0000000000000ca1 2018-11-26 13:08:01.544: [GIPCDCLT][4166940416] gipcdClientThread: req from local client of type gipcdmsgtypeInterfaceMetrics, endp 0000000011befc2f 2018-11-26 13:08:01.546: [GIPCDMON][4093638400] gipcdMonitorCssCheck: found node sxmms2 2018-11-26 13:08:01.546: [GIPCDMON][4093638400] gipcdMonitorFailZombieNodes: skipping live node 'sxmms1', time 737518596 ms, endp 0000000000000000, 00000000470e5359 2018-11-26 13:08:01.561: [GIPCDCLT][4166940416] gipcdClientThread: req from local client of type gipcdmsgtypeInterfaceMetrics, endp 0000000000000355 2018-11-26 13:08:02.248: [GIPCDCLT][4166940416] gipcdClientThread: req from local client of type gipcdmsgtypeInterfaceMetrics, endp 0000000011befdfb 2018-11-26 13:08:02.401: [ CLSINET][4093638400] Returning NETDATA: 1 interfaces 2018-11-26 13:09:41.659: [GIPCDMON][4093638400] gipcdMonitorCssCheck: found node sxmms1 2018-11-26 13:09:41.659: [GIPCDMON][4093638400] gipcdMonitorCssCheck: updating timeout node sxmms1 2018-11-26 13:09:41.659: [GIPCDMON][4093638400] gipcdMonitorCssCheck: found node sxmms2 2018-11-26 13:09:41.659: [GIPCDMON][4093638400] gipcdMonitorFailZombieNodes: skipping live node 'sxmms1', time 0 ms, endp 0000000000000000, 00000000470e5359 2018-11-26 13:09:41.705: [GIPCHALO][4091537152] gipchaLowerDropMsg: dropping because of sequence timeout, waited 30050, msg 0x7f00dc0a8478 { len 1160, seq 2, type gipchaHdrTypeRecvEstablish (5), lastSeq 0, lastAck 0, minAck 1, flags 0x1, srcLuid bcd67f68-d3658d20, dstLuid 00000000-00000000, msgId 1 }, node 0x7f00d02332c0 { host 'sxmms1', haName 'gipcd_ha_name', srcLuid 3de74e37-fe7418b0, dstLuid bcd67f68-d3658d20 numInf 1, contigSeq 0, lastAck 0, lastValidAck 0, sendSeq [30 : 30], createTime 737588686, sentRegister 1, localMonitor 1, flags 0x0 } 2018-11-26 13:09:42.350: [GIPCDCLT][4166940416] gipcdClientThread: req from local client of type gipcdmsgtypeInterfaceMetrics, endp 0000000011befdfb 2018-11-26 13:09:42.427: [ CLSINET][4093638400] Returning NETDATA: 1 interfaces 2018-11-26 13:09:42.427: [ CLSINET][4093638400] # 0 Interface 'eth3',ip='192.168.0.2',mac='a0-36-9f-5d-66-ec',mask='255.255.255.0',net='192.168.0.0',use='cluster_interconnect' 2018-11-26 13:09:42.707: [GIPCHALO][4091537152] gipchaLowerDropMsg: dropping because of sequence timeout, waited 30060, msg 0x7f00dc0c71b8 { len 1160, seq 3, type gipchaHdrTypeRecvEstablish (5), lastSeq 0, lastAck 0, minAck 2, flags 0x1, srcLuid bcd67f68-d3658d20, dstLuid 00000000-00000000, msgId 2 }, node 0x7f00d02332c0 { host 'sxmms1', haName 'gipcd_ha_name', srcLuid 3de74e37-fe7418b0, dstLuid bcd67f68-d3658d20 numInf 1, contigSeq 0, lastAck 0, lastValidAck 0, sendSeq [31 : 31], createTime 737588686, sentRegister 1, localMonitor 1, flags 0x0 } 2018-11-26 13:09:42.708: [GIPCHALO][4091537152] gipchaLowerDropMsg: dropping because of sequence timeout, waited 30060, msg 0x7f00dc038cc8 { len 1160, seq 3, type gipchaHdrTypeRecvEstablish (5), lastSeq 0, lastAck 0, minAck 2, flags 0x1, srcLuid bcd67f68-d3658d20, dstLuid 00000000-00000000, msgId 2 }, node 0x7f00d02332c0 { host 'sxmms1', haName 'gipcd_ha_name', srcLuid 3de74e37-fe7418b0, dstLuid bcd67f68-d3658d20 numInf 1, contigSeq 0, lastAck 0, lastValidAck 0, sendSeq [31 : 31], createTime 737588686, sentRegister 1, localMonitor 1, flags 0x0 } 2018-11-26 13:09:42.708: [GIPCHALO][4091537152] gipchaLowerDropMsg: dropping because of sequence timeout, waited 30060, msg 0x7f00dc04f288 { len 1160, seq 3, type gipchaHdrTypeRecvEstablish (5), lastSeq 0, lastAck 0, minAck 2, flags 0x1, srcLuid bcd67f68-d3658d20, dstLuid 00000000-00000000, msgId 2 }, node 0x7f00d02332c0 { host 'sxmms1', haName 'gipcd_ha_name', srcLuid 3de74e37-fe7418b0, dstLuid bcd67f68-d3658d20 numInf 1, contigSeq 0, lastAck 0, lastValidAck 0, sendSeq [31 : 31], createTime 737588686, sentRegister 1, localMonitor 1, flags 0x0 } 2018-11-26 13:09:42.708: [GIPCHALO][4091537152] gipchaLowerProcessNode: no valid interfaces found to node for 737619746 ms, node 0x7f00d02332c0 { host 'sxmms1', haName 'gipcd_ha_name', srcLuid 3de74e37-fe7418b0, dstLuid bcd67f68-d3658d20 numInf 1, contigSeq 0, lastAck 0, lastValidAck 0, sendSeq [31 : 31], createTime 737588686, sentRegister 1, localMonitor 1, flags 0x4 } 2018-11-26 13:09:42.708: [GIPCDCLT][4166940416] gipcdClientThread: req from local client of type gipcdmsgtypeInterfaceMetrics, endp 0000000000000355 |
通过以上过程分析,1节点CRS无法启动的原因为2节点gipc进程异常,进而导致两个节点间无法正常建立连接,而gipc为RAC的重要组成部分,从11gR2(11.2.0.2)开始,oracle决定由集群自己来管理私网网卡,集群新特性gipc(Grid IPC)被介绍,这个新特性以守护进程gipcd.bin的形式存在于集群中,主要的功能如下:
1.当集群启动时,发现集群的私网网卡,集群私网的信息是从gpnp profile中获得的。并对发现的私网接口进行检查;
2.利用之前发现的私网网卡,发现集群中的其他节点,并和其他节点的私网网卡建立联系;
3.如果集群配置了多块私网网卡,当某个节点的某一个/几个私网网卡出现问题时,离线有问题的私网,并通知其他节点;
确认gipcd.bin的作用后,其实1节点CRS无法启动的原因就已经找到,集群私网的连接是通过该进程实现,但2节点gipc进程处于异常状态,所以1节点经过多次重启始终无法加入集群。
从以上分析确定为2节点gipc进程异常导致的1节点CRS无法正常启动,虽然gipc是私网连接使用,但它本身的重启不会导致集群异常,所以通过手动kill -9 gipcd.bin进程,随后gipc进程会自动启动,而1节点也随之启动成功。
感谢各位的阅读,以上就是“怎么解决oracle中由于gipc导致某节点crs无法启动问题”的内容了,经过本文的学习后,相信大家对怎么解决oracle中由于gipc导致某节点crs无法启动问题这一问题有了更深刻的体会,具体使用情况还需要大家实践验证。这里是编程网,小编将为大家推送更多相关知识点的文章,欢迎关注!
--结束END--
本文标题: 怎么解决oracle中由于gipc导致某节点crs无法启动问题
本文链接: https://www.lsjlt.com/news/64835.html(转载时请注明来源链接)
有问题或投稿请发送至: 邮箱/279061341@qq.com QQ/279061341
下载Word文档到电脑,方便收藏和打印~
2024-05-15
2024-05-15
2024-05-15
2024-05-15
2024-05-15
2024-05-15
2024-05-15
2024-05-15
2024-05-15
2024-05-15
回答
回答
回答
回答
回答
回答
回答
回答
回答
回答


官方手机版

微信公众号

商务合作


0