目录前言引入相关库文件绘制提示文字鼠标绘制线设置距离信息窗绘制完成取消绘制全部代码前言 首先呢说明一下,我是跟着一个大佬学的,所以我是个小次佬,openlayer的官网上面给出了案例
首先呢说明一下,我是跟着一个大佬学的,所以我是个小次佬,openlayer的官网上面给出了案例,但是习惯Vue开发的我完全不理解,关键是连注释都没多少,而且我 openlayer 用的本来就不多。
然后这里分享一下官网的测距案例
这个库文件直接按照官网的来就可以了。 首先说一个事情哈,官网用的案例是地图使用的 EPSG:3857, 如果我们改成 EPSG:4326,测量数据不准确,切记这一点。
  import 'ol/ol.CSS';
  import Draw from 'ol/interaction/Draw';
  import Map from 'ol/Map';
  import Overlay from 'ol/Overlay';
  import View from 'ol/View';
  import { Circle as CircleStyle, Fill, Stroke, Style } from 'ol/style';
  import { LineString, PolyGon } from 'ol/geom';
  import { OSM, Vector as VectorSource } from 'ol/source';
  import { Tile as TileLayer, Vector as VectorLayer } from 'ol/layer';
  import { getArea, getLength } from 'ol/sphere';
  import { unByKey } from 'ol/Observable';
上面是我引入的库文件,和官网基本上一样。
首先我们看下图官网效果,官网开始绘制或者是绘制中都在鼠标旁边有一个title文本框用来提示用户操作信息。
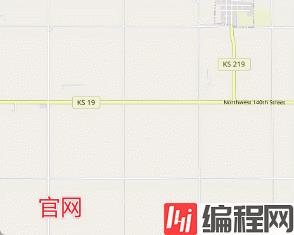
我们首先来实现一下这个功能。
首先说明一点哈,这是关键代码,有些参数可能用起来发现没有声明,都是全局的,自己加在全局就可以,主要是下面这一些。
  var map = null
  var helpTooltipElement = null
  var feature = null;
  var helpTooltip = null;
  var draw = null;
  var measureTooltipElement = null;
  var measureTooltip = null;
  var listener = null;
  var mapMouseMove = null;
首先我们在需要实现测距功能的页面上写两个按钮,一个开始测距,一个结束测距。然后点击开始测距的时候,执行一个方法,假设是distance方法。
  distance() {
        let source = new VectorSource()  // 首先创建一个数据源,用来放置绘制过程中和绘制结束后的线段
        const layer = new VectorLayer({  // 添加一个图层,用来放置数据源,样式自己随便设置就可以了,我这里默认的官网
          source: source,
          style: new Style({
            fill: new Fill({
              color: 'rgba(255, 255, 255, 0.2)',
            }),
            stroke: new Stroke({
              color: '#ffcc33',
              width: 4,
            }),
            image: new CircleStyle({
              radius: 7,
              fill: new Fill({
                color: '#ffcc33',
              }),
            }),
          }),
        });
        mapMouseMove = map.on('pointermove', (ev) => {  // 给地图添加一个鼠标移动事件
          let helpMsg = '点击开始测量'    // 默认开始的操作提示文本
          if (feature) {  // featuer 是全局的,判断有没有点击鼠标绘制过
            helpMsg = '双击结束测量'    // 如果之前点击绘制了就显示双击结束
          }
          helpTooltipElement.innerhtml = helpMsg;   // 设置dom的提示文字
          helpTooltip.setPosition(ev.coordinate);  // 设置位置跟着鼠标走
          helpTooltipElement.classList.remove('hidden')  // 让他显示出来
        })
        this.createHelpTooltip()   // 创建那个helpTooltipElement方法
        map.addLayer(layer)  // 把图层添加到地图
      },
然后调用了一个初始化操作提示的dom元素。这个就是官网的函数,如果参数名和自己起的或者是map的指向问题需要自己根据自己的实际修改一下。
      createHelpTooltip() {
        if (helpTooltipElement) {
          helpTooltipElement.parentnode.removeChild(helpTooltipElement);
        }
        helpTooltipElement = document.createElement('div');
        helpTooltipElement.className = 'ol-tooltip hidden';
        helpTooltip = new Overlay({
          element: helpTooltipElement,
          offset: [15, 0],
          positioning: 'center-left',
        });
        map.addOverlay(helpTooltip);
      },
还有一点,为了好看,把官网的样式复制一下子。
<style scoped>
  /deep/.ol-tooltip {
    position: relative;
    background: rgba(0, 0, 0, 0.5);
    border-radius: 4px;
    color: white;
    padding: 4px 8px;
    opacity: 0.7;
    white-space: nowrap;
    font-size: 12px;
    cursor: default;
    user-select: none;
  }

  /deep/.ol-tooltip-measure {
    opacity: 1;
    font-weight: bold;
  }

  /deep/.ol-tooltip-static {
    background-color: #ffcc33;
    color: black;
    border: 1px solid white;
  }

  /deep/.ol-tooltip-measure:before,
  /deep/.ol-tooltip-static:before {
    border-top: 6px solid rgba(0, 0, 0, 0.5);
    border-right: 6px solid transparent;
    border-left: 6px solid transparent;
    content: "";
    position: absolute;
    bottom: -6px;
    margin-left: -7px;
    left: 50%;
  }

  /deep/.ol-tooltip-static:before {
    border-top-color: #ffcc33;
  }
</style>
然后就可以看到我们点击“开始测距”按钮之后,上面代码执行,鼠标旁边就出现一个小小的操作提示。

好的,通过上面的代码呢,我们成功的绘制出了提示框,然后就是鼠标绘制,代码也很简单,在map监听的pointermove方法中,继续创建一个draw进行绘制,关键代码就是下面:
		draw = new Draw({
          source,  // 这个数据源就是我们最开始的那个数据源,这是简写,实际上是 source:source,
          type: 'LineString',  // 绘制线
          style: new Style({   // 绘制完成之前线的样式,这是官网的样式,需要的话自己可以修改成自己想要的样子
            fill: new Fill({
              color: 'rgba(255, 255, 255, 0.2)',
            }),
            stroke: new Stroke({
              color: 'rgba(0, 0, 0, 0.5)',
              lineDash: [10, 10],
              width: 4,
            }),
            image: new CircleStyle({
              radius: 5,
              stroke: new Stroke({
                color: 'rgba(0, 0, 0, 0.7)',
              }),
              fill: new Fill({
                color: 'rgba(255, 255, 255, 0.2)',
              }),
            }),
          }),
        });
然后把draw绑定到地图上面。
map.addInteraction(draw); // draw 绑定到地图上面去
然后就实现了鼠标绘制线。
在我们点击开始测量的时候呢,在我们拖动鼠标的时候,会在上方显示出当前距离起点的距离,这个地方代码实现就是下面的样子,继续在上面的代码后面写:
		// 开始监听绘制
        draw.on('drawstart', (evt) => {
          feature = evt.feature;  // feature就是全局的
          let tooltipCoord = evt.coordinate;  // 鼠标当前的位置
          listener = feature.getGeometry().on('change', function (evt) {
            const geom = evt.target;
            let output = fORMatLength(geom);   // 距离的格式
            tooltipCoord = geom.getLastCoordinate();    // 设置鼠标位置改变后的实时位置
            measureTooltipElement.innerHTML = output;  // 设置提示框的内容,就是距离
            measureTooltip.setPosition(tooltipCoord);  // 设置距离提示框的位置
          });
        });

        // 格式化长度, 直接官网代码
        const formatLength = function (line) {
          const length = getLength(line);
          let output;
          if (length > 100) {
            output = Math.round((length / 1000) * 100) / 100 + ' ' + 'km';
          } else {
            output = Math.round(length * 100) / 100 + ' ' + 'm';
          }
          return output;
        };

		this.createMeasureTooltip()  // 创建那个距离的提示框
然后上面代码调用了一个方法。
	createMeasureTooltip() {
        if (measureTooltipElement) {
          measureTooltipElement.parentNode.removeChild(measureTooltipElement);
        }
        measureTooltipElement = document.createElement('div');
        measureTooltipElement.className = 'ol-tooltip ol-tooltip-measure';
        measureTooltip = new Overlay({
          element: measureTooltipElement,
          offset: [0, -15],
          positioning: 'bottom-center',
          stopEvent: false,
          insertFirst: false,
        });
        this.drawElements.push(measureTooltip)
        map.addOverlay(measureTooltip);
      },
完成上面的代码之后,我们在点击开始测量之后,会在鼠标上方实时显示当前鼠标位置距离起点的距离。
上边已经实现了点击开始测距,并且实时显示距离信息,接下来就是双击完成时候显示出总长度。
继续在之前代码后边写:
		// 双击绘制完成
        draw.on('drawend', () => {
          measureTooltipElement.className = 'ol-tooltip ol-tooltip-static';
          measureTooltip.setOffset([0, -7]);
          feature = null;
          measureTooltipElement = null;
          this.createMeasureTooltip();
          unByKey(listener);
        });
上边的代码基本上就是官网的代码,但是变量名不一样的地方需要稍微改一下。
通过上面的代码就实现了双击测量完成的功能。
OK,到此为止,测距功能全部完成!
绘制功能完成了,就需要取消绘制,取消绘制需要在点击“取消绘制”按钮之后,取消地图绘制功能,删除界面上已经绘制过的内容。
首先我们需要删除地图上绘制过的内容,包括连线,以及弹窗。
这个地方需要注意一下,我们需要把绘制的图层,比如连线,和弹窗都保存到一个或者是几个列表里面,然后在点击按钮的时候,去遍历删除。
所以说我们要在点击测距时候加载到地图的图层之后,将创建的图层添加到一个数组存起来。
map.addLayer(layer)
this.drawLayers.push(layer)  // 保存起来
包括那个总距离的弹窗。
this.drawElements.push(measureTooltip)
map.addOverlay(measureTooltip);  // 保存起来
然后点击“取消测量”按钮的时候执行下面的代码:
      // 取消绘制
      cancal() {
        for(let i = 0 ; i< this.drawLayers.length; i++) {
          map.removeLayer(this.drawLayers[i])
        }
        for (let i = 0; i < this.drawElements.length; i++) {
          map.removeOverlay(this.drawElements[i])
        }
        this.drawLayers = []
        this.drawElements = []
        map.removeInteraction(draw)
        unByKey(mapMouseMove);
      },
这样就可以了。
这样就完成了!
这里分享一下全部代码,就不放资源了,下载还花钱,我也是跟人家学的,没必要都。
<template>
  <div class="home">
    <div class="set">
      <button class="btn" @click="distance()">测距</button>
      <button class="btn" @click="cancal()">取消</button>
    </div>
    <div id="map" ref="map"></div>
  </div>
</template>

<script>
  import 'ol/ol.css';
  import Draw from 'ol/interaction/Draw';
  import Map from 'ol/Map';
  import Overlay from 'ol/Overlay';
  import View from 'ol/View';
  import { Circle as CircleStyle, Fill, Stroke, Style } from 'ol/style';
  import { LineString, Polygon } from 'ol/geom';
  import { OSM, Vector as VectorSource } from 'ol/source';
  import { Tile as TileLayer, Vector as VectorLayer } from 'ol/layer';
  import { getArea, getLength } from 'ol/sphere';
  import { unByKey } from 'ol/Observable';

  var map = null

  var helpTooltipElement = null
  var feature = null;
  var helpTooltip = null;
  var draw = null;
  var measureTooltipElement = null;
  var measureTooltip = null;
  var listener = null;
  var mapMouseMove = null;

  export default {
    name: "Home",
    data() {
      return {
        drawLayers: [],
        drawElements: [],
      }
    },
    mounted() {
      this.initMap()
    },
    methods: {
      // 初始化地图
      initMap() {

        map = new Map({
          layers: [
            new TileLayer({
              source: new OSM(),
            }),
          ],
          target: 'map',
          view: new View({
            center: [0, 0],
            zoom: 5,
            maxZoom: 18,
            // projection: 'EPSG:4326',
            constrainResolution: true,  // 设置缩放级别为整数
            smoothResolutionConstraint: false,  // 关闭无级缩放地图
          }),
        });
      },


      // 测距
      distance() {

        let source = new VectorSource()
        const layer = new VectorLayer({
          source: source,
          style: new Style({
            fill: new Fill({
              color: 'rgba(255, 255, 255, 0.2)',
            }),
            stroke: new Stroke({
              color: '#ffcc33',
              width: 4,
            }),
            image: new CircleStyle({
              radius: 7,
              fill: new Fill({
                color: '#ffcc33',
              }),
            }),
          }),
        });

        mapMouseMove = map.on('pointermove', (ev) => {
          let helpMsg = '点击开始测量'
          if (feature) {
            helpMsg = '双击结束测量'
          }
          helpTooltipElement.innerHTML = helpMsg;
          helpTooltip.setPosition(ev.coordinate);
          helpTooltipElement.classList.remove('hidden')

        })

        map.getViewport().addEventListener('mouseout', function () {
          helpTooltipElement.classList.add('hidden');
        });

        draw = new Draw({
          source,
          type: 'LineString',
          style: new Style({
            fill: new Fill({
              color: 'rgba(255, 255, 255, 0.2)',
            }),
            stroke: new Stroke({
              color: 'rgba(0, 0, 0, 0.5)',
              lineDash: [10, 10],
              width: 4,
            }),
            image: new CircleStyle({
              radius: 5,
              stroke: new Stroke({
                color: 'rgba(0, 0, 0, 0.7)',
              }),
              fill: new Fill({
                color: 'rgba(255, 255, 255, 0.2)',
              }),
            }),
          }),
        });

        // 开始坚挺绘制
        draw.on('drawstart', (evt) => {
          feature = evt.feature;

          let tooltipCoord = evt.coordinate;

          listener = feature.getGeometry().on('change', function (evt) {
            const geom = evt.target;
            let output = formatLength(geom);
            tooltipCoord = geom.getLastCoordinate();
            measureTooltipElement.innerHTML = output;
            measureTooltip.setPosition(tooltipCoord);
          });
        });

        // 双击绘制完成
        draw.on('drawend', () => {
          measureTooltipElement.className = 'ol-tooltip ol-tooltip-static';
          measureTooltip.setOffset([0, -7]);
          feature = null;
          measureTooltipElement = null;
          this.createMeasureTooltip();
          unByKey(listener);
        });

        // 格式化长度
        const formatLength = function (line) {
          const length = getLength(line);
          let output;
          if (length > 100) {
            output = Math.round((length / 1000) * 100) / 100 + ' ' + 'km';
          } else {
            output = Math.round(length * 100) / 100 + ' ' + 'm';
          }
          return output;
        };

        this.createHelpTooltip()
        this.createMeasureTooltip()
        map.addLayer(layer)
        this.drawLayers.push(layer)
        map.addInteraction(draw);
      },

      // 取消绘制
      cancal() {
        for(let i = 0 ; i< this.drawLayers.length; i++) {
          map.removeLayer(this.drawLayers[i])
        }
        for (let i = 0; i < this.drawElements.length; i++) {
          map.removeOverlay(this.drawElements[i])
        }
        this.drawLayers = []
        this.drawElements = []
        map.removeInteraction(draw)
        unByKey(mapMouseMove);
      },

      createMeasureTooltip() {
        if (measureTooltipElement) {
          measureTooltipElement.parentNode.removeChild(measureTooltipElement);
        }
        measureTooltipElement = document.createElement('div');
        measureTooltipElement.className = 'ol-tooltip ol-tooltip-measure';
        measureTooltip = new Overlay({
          element: measureTooltipElement,
          offset: [0, -15],
          positioning: 'bottom-center',
          stopEvent: false,
          insertFirst: false,
        });
        this.drawElements.push(measureTooltip)
        map.addOverlay(measureTooltip);
      },

      createHelpTooltip() {
        if (helpTooltipElement) {
          helpTooltipElement.parentNode.removeChild(helpTooltipElement);
        }
        helpTooltipElement = document.createElement('div');
        helpTooltipElement.className = 'ol-tooltip hidden';
        helpTooltip = new Overlay({
          element: helpTooltipElement,
          offset: [15, 0],
          positioning: 'center-left',
        });
        map.addOverlay(helpTooltip);
      },

    },
  };

</script>
<style scoped>
  .home {
    width: 100%;
    height: 100%;
    background-color: aliceblue;
    position: relative;
  }

  #map {
    height: 100%;
    width: 100%;
  }

  .set {
    position: absolute;
    top: 0px;
    right: 0px;
    z-index: 99;
  }

  .btn {
    margin: 10px;
  }

  /deep/.hidden {
    display: none;
  }

  /deep/.ol-tooltip {
    position: relative;
    background: rgba(0, 0, 0, 0.5);
    border-radius: 4px;
    color: white;
    padding: 4px 8px;
    opacity: 0.7;
    white-space: nowrap;
    font-size: 12px;
    cursor: default;
    user-select: none;
  }

  /deep/.ol-tooltip-measure {
    opacity: 1;
    font-weight: bold;
  }

  /deep/.ol-tooltip-static {
    background-color: #ffcc33;
    color: black;
    border: 1px solid white;
  }

  /deep/.ol-tooltip-measure:before,
  /deep/.ol-tooltip-static:before {
    border-top: 6px solid rgba(0, 0, 0, 0.5);
    border-right: 6px solid transparent;
    border-left: 6px solid transparent;
    content: "";
    position: absolute;
    bottom: -6px;
    margin-left: -7px;
    left: 50%;
  }

  /deep/.ol-tooltip-static:before {
    border-top-color: #ffcc33;
  }
</style>
以上就是Vue+OpenLayer实现测距功能 的详细内容,更多关于Vue OpenLayer测距的资料请关注编程网其它相关文章!
--结束END--
本文标题: Vue+OpenLayer实现测距功能
本文链接: https://www.lsjlt.com/news/146671.html(转载时请注明来源链接)
有问题或投稿请发送至: 邮箱/279061341@qq.com QQ/279061341
下载Word文档到电脑,方便收藏和打印~
2024-01-12
2023-05-20
2023-05-20
2023-05-20
2023-05-20
2023-05-20
2023-05-20
2023-05-20
2023-05-20
2023-05-20
回答
回答
回答
回答
回答
回答
回答
回答
回答
回答
一口价域名售卖能注册吗?域名是网站的标识,简短且易于记忆,为在线用户提供了访问我们网站的简单路径。一口价是在域名交易中一种常见的模式,而这种通常是针对已经被注册的域名转售给其他人的一种方式。
一口价域名买卖的过程通常包括以下几个步骤:
1.寻找:买家需要在域名售卖平台上找到心仪的一口价域名。平台通常会为每个可售的域名提供详细的描述,包括价格、年龄、流
443px" 443px) https://www.west.cn/docs/wp-content/uploads/2024/04/SEO图片294.jpg https://www.west.cn/docs/wp-content/uploads/2024/04/SEO图片294-768x413.jpg 域名售卖 域名一口价售卖 游戏音频 赋值/切片 框架优势 评估指南 项目规模

官方手机版

微信公众号

商务合作


0