目录前言移除图例改变图例位置修改图例的边框和背景改变图例顺序反转图例顺序修改图例标题修改图例标题外观移除图例标题修改图例标签修改图例标签外观总结前言 大家经常对ggplot2中的图例
大家经常对ggplot2中的图例不满意,想要各种修改,今天就介绍下图例的各种修改细节,基本上常用的操作都涉及到了!
library(ggplot2)
library(GCookbook)
提供3种方法可以在ggplot2中移除图例。
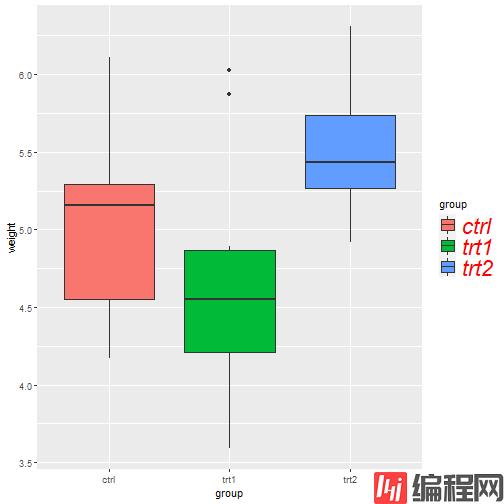
# 基本图形
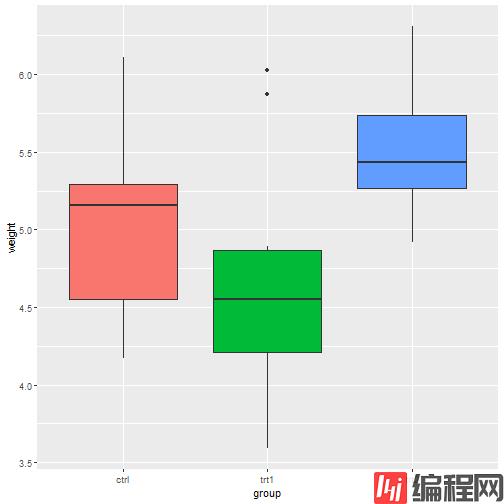
pg_plot <- ggplot(PlantGrowth, aes(x = group, y = weight, fill = group)) +
geom_boxplot()
pg_plot

# 首先可以使用guides()函数移除图例
pg_plot +
  guides(fill = "none")

然后可以在scale_**函数中移除,这里是fill,你要根据自己的情况换成shape、color等。
pg_plot+scale_fill_discrete(guide = "none")

第3种方法是在theme中移除。
pg_plot+theme(legend.position = "none")
也是在theme中更改,
pg_plot <- ggplot(PlantGrowth, aes(x = group, y = weight, fill = group)) +
  geom_boxplot() +
  scale_fill_brewer(palette = "Pastel2")

pg_plot +
  theme(legend.position = "top") # 放在顶部
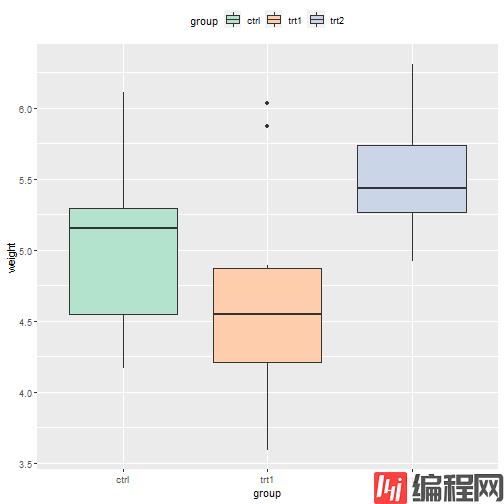
legend.position的参数可以是left、right、top、bottom,还可以是坐标。
pg_plot+theme(legend.position = c(0.8,0.3))
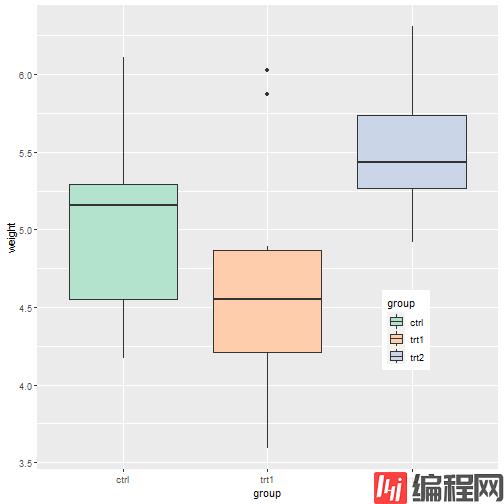
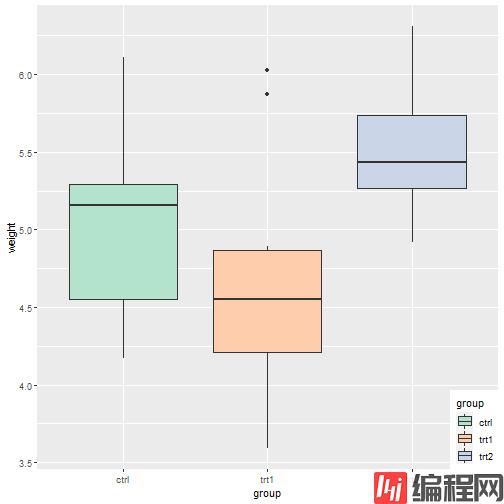
在ggplot2中,左下角的坐标是c(0,0),右上角的坐标是c(1,1),你可以自己设置想要放置的位置。需要注意的是,你设置的这个坐标是图例中心点的坐标,可以通过legend.justification设置图例的哪个位置放在你的坐标上。
# 图例右下角,放在画布右下角
pg_plot +
  theme(legend.position = c(1, 0), legend.justification = c(1, 0))
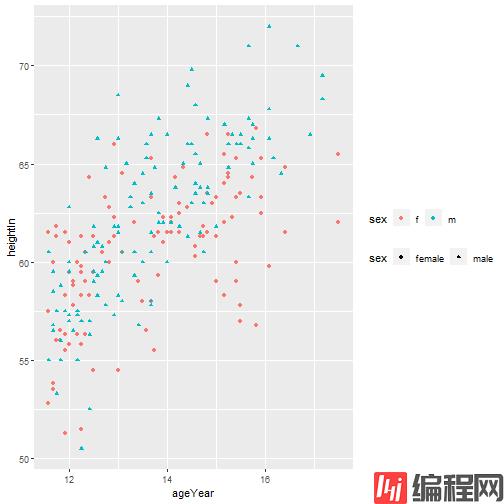
p <- ggplot(heightweight, aes(x=ageYear, y=heightIn, shape=sex, colour=sex))+geom_point()
p

两个图例更改为水平排列:
p + scale_shape_discrete(label = c("female","male")) +
  theme(legend.direction = "horizontal")
pg_plot+
  theme(legend.position = c(0.85,0.2))+
  theme(legend.background = element_rect(fill = "orange",color = "black"))
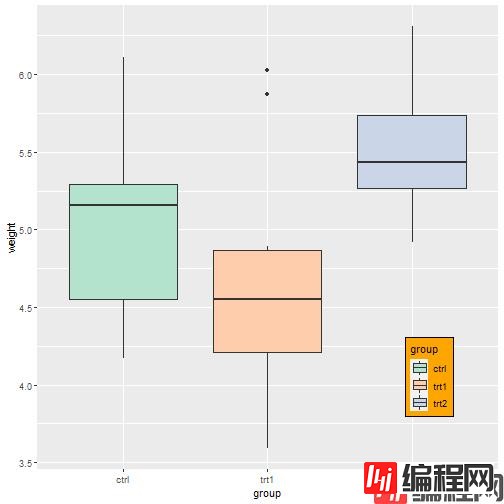
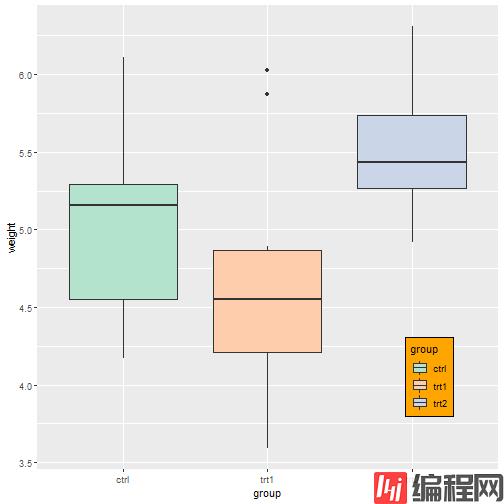
中间还有一部分是白色,需要另外一个参数修改:
pg_plot+
  theme(legend.position = c(0.85,0.2))+
  theme(legend.background = element_rect(fill = "orange",color = "black"),
        legend.key = element_rect(fill = "orange")
        )
pg_plot <- ggplot(PlantGrowth, aes(x = group, y = weight, fill = group)) +
  geom_boxplot()

pg_plot

# limits
pg_plot +
  scale_fill_discrete(limits = c("trt1", "trt2", "ctrl"))
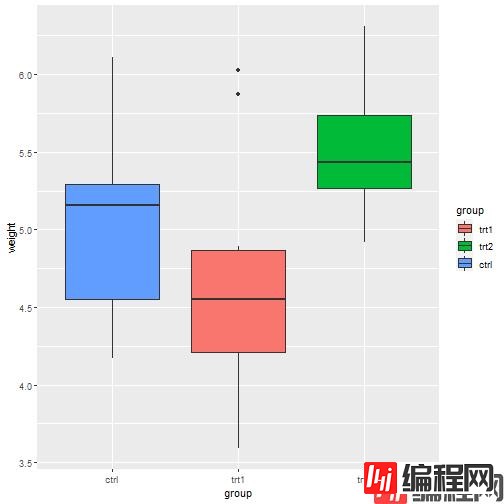
也可以在画图之前,通过因子化的方法把数据先排好序再画图哦。
2种方法。
pg_plot+scale_fill_discrete(guide = guide_legend(reverse = T))

pg_plot+guides(fill = guide_legend(reverse = T))

2种方法。
pg_plot <- ggplot(PlantGrowth, aes(x = group, y = weight, fill = group)) +
  geom_boxplot()

pg_plot

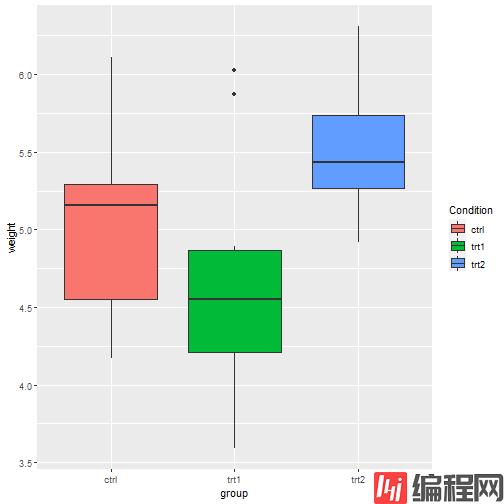
labs里面修改
pg_plot + labs(fill = "Condition")
在scale_*函数里面修改。
pg_plot+scale_fill_discrete(name = "hahah")
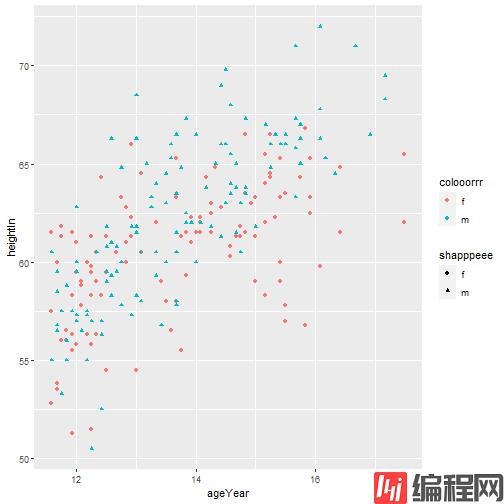
还有一种比较复杂的情况,如果多个一个变量映射给多个图形参数,或者有多个图例,怎么修改呢?像下面这个例子,sex和shape、color都有关。
p <- ggplot(heightweight, aes(x=ageYear, y=heightIn, shape=sex, colour=sex))+geom_point()
p

可以在scale_*函数中修改:
p + scale_shape_discrete(name = "shape")+
  scale_color_discrete(name = "colooorrr")

也可以在legend中修改:
p + labs(shape = "shapppeee",color = "colooorrr")
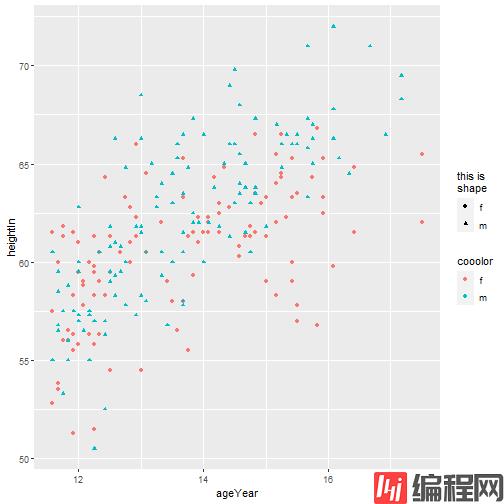
还可以在guides函数中修改:
p + guides(shape = guide_legend(title = "this is\nshape"),
           color = guide_legend(title = "cooolor")
           )
pg_plot <- ggplot(PlantGrowth, aes(x = group, y = weight, fill = group)) +
  geom_boxplot()
pg_plot

可以在theme中修改:
pg_plot + theme(
  legend.title = element_text(
    face = "italic",
    family = "Times",
    colour = "red",
    size = 18
  )
)

也可以在guides中修改:
pg_plot +
  guides(fill = guide_legend(title.theme = element_text(
    face = "italic",
    family = "Times",
    colour = "red",
    size = 14))
  )

pg_plot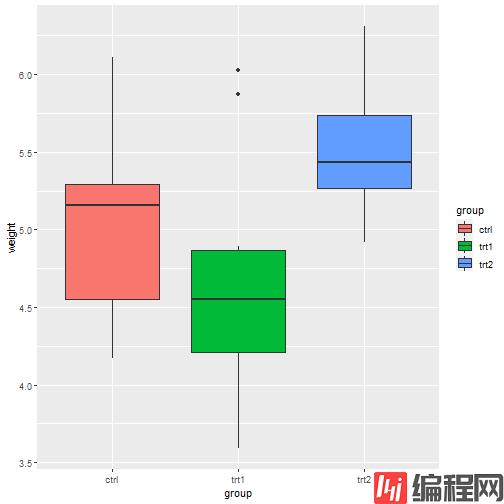
可以在theme中修改,也可以在scale_xxx函数中修改,也可以在guides函数中修改。
pg_plot+theme(legend.title = element_blank())
pg_plot+scale_fill_discrete(name = NULL)
pg_plot+scale_fill_hue(guide = guide_legend(title = NULL))
pg_plot+guides(fill = guide_legend(title = NULL))
pg_plot
pg_plot+scale_fill_discrete(labels = c("label1","label2","label3"))
在theme中修改:
pg_plot +
  theme(legend.text = element_text(
    colour = "red",
    face = "italic",
    size = 22)
  )
到此这篇关于R语言ggplot2图例修改的文章就介绍到这了,更多相关R语言ggplot2图例修改内容请搜索编程网以前的文章或继续浏览下面的相关文章希望大家以后多多支持编程网!
--结束END--
本文标题: R语言ggplot2图例修改超详细介绍
本文链接: https://www.lsjlt.com/news/170707.html(转载时请注明来源链接)
有问题或投稿请发送至: 邮箱/279061341@qq.com QQ/279061341
下载Word文档到电脑,方便收藏和打印~
2024-03-01
2024-03-01
2024-02-29
2024-02-29
2024-02-29
2024-02-29
2024-02-29
2024-02-29
2024-02-29
2024-02-29
回答
回答
回答
回答
回答
回答
回答
回答
回答
回答


官方手机版

微信公众号

商务合作


0