Python 官方文档:入门教程 => 点击学习
先附上官方文档:https://pandas.pydata.org/pandas-docs/stable/reference/api/pandas.DataFrame.describ
先附上官方文档:
https://pandas.pydata.org/pandas-docs/stable/reference/api/pandas.DataFrame.describe.html
describe()有三个参数:
DataFrame.describe(percentiles=None, include=None, exclude=None)
# return:Series or DataFrame.   Summary statistics of the Series or Dataframe provided.
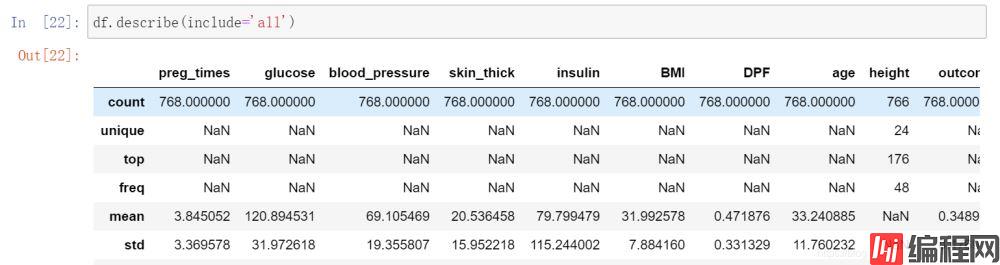
1.include=‘all’,代表对所有列进行统计,如果不加这个参数,则只对数值列进行统计
datafile.describe(include='all')
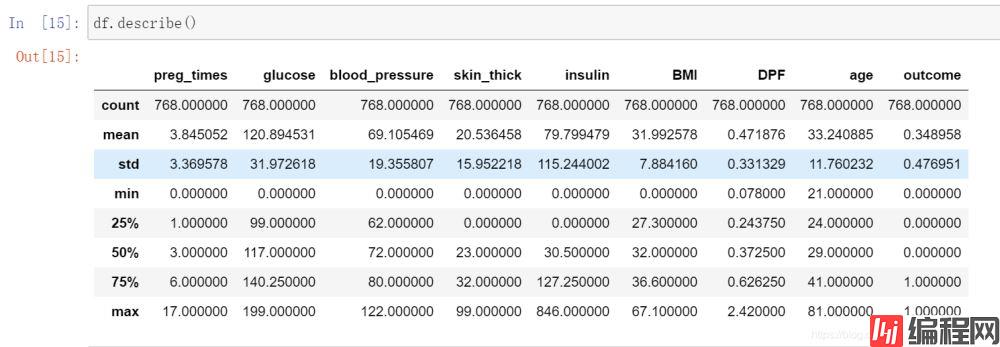
没加参数的少了height列(height为离散型变量,其余为数值型):
加了参数include=‘all’,出现height变量:
2.统计变量说明:
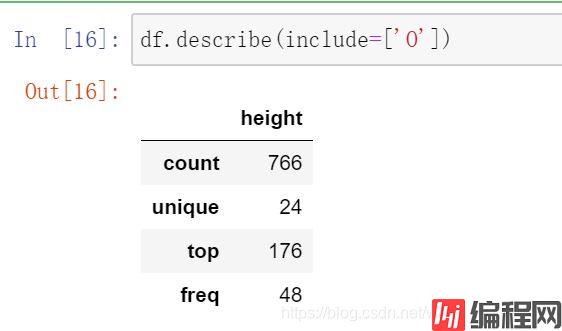
3.仅仅显示离散型变量:include=[‘O’]
df.describe(include=['O'])只显示了height列:
4.第一个percentiles,这个参数可以设定数值型特征的统计量,默认[.25, .5, .75],返回25%,50%,75%时候的数据,可修改参数,**如:
df.describe(percentiles=[.10, .75, .8])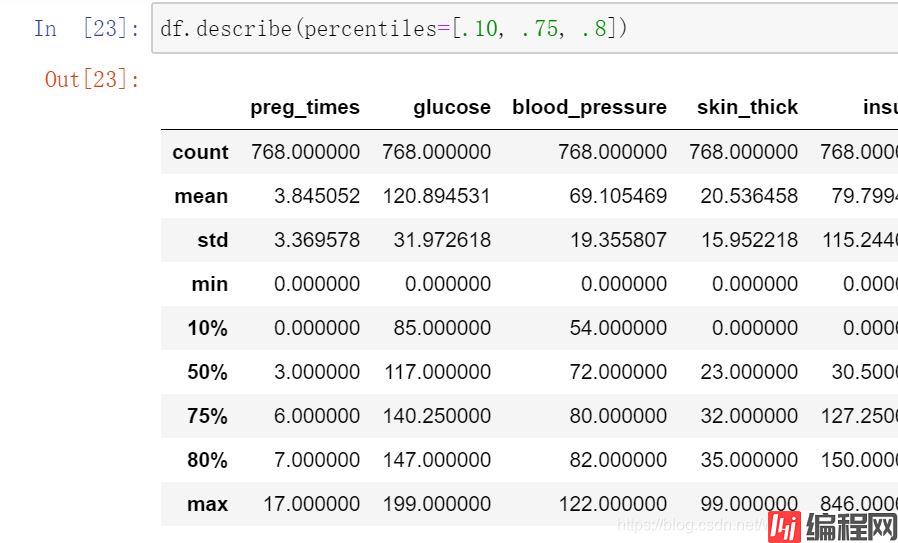
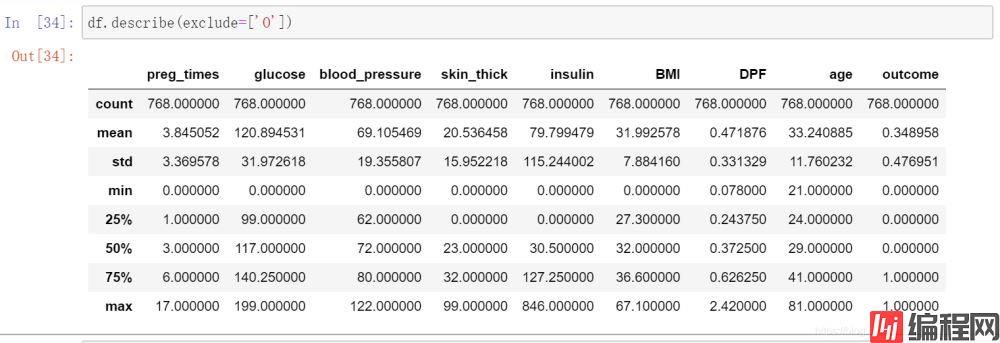
5.第三个参数可以指定不选择哪些列。
例如
df.describe(exclude=['O'])height列没有了:
到此这篇关于Pandas中describe()函数的具体使用的文章就介绍到这了,更多相关Pandas describe()内容请搜索编程网以前的文章或继续浏览下面的相关文章希望大家以后多多支持编程网!
--结束END--
本文标题: Pandas中describe()函数的具体使用
本文链接: https://www.lsjlt.com/news/177996.html(转载时请注明来源链接)
有问题或投稿请发送至: 邮箱/279061341@qq.com QQ/279061341
下载Word文档到电脑,方便收藏和打印~
2024-03-01
2024-03-01
2024-03-01
2024-02-29
2024-02-29
2024-02-29
2024-02-29
2024-02-29
2024-02-29
2024-02-29
回答
回答
回答
回答
回答
回答
回答
回答
回答
回答


官方手机版

微信公众号

商务合作


0