这篇文章主要介绍SpringBoot如何使用prometheus监控,文中介绍的非常详细,具有一定的参考价值,感兴趣的小伙伴们一定要看完!1.关于PrometheusPrometheus是一个根据应用的metrics来进行监控的开源工具。相
这篇文章主要介绍SpringBoot如何使用prometheus监控,文中介绍的非常详细,具有一定的参考价值,感兴趣的小伙伴们一定要看完!
Prometheus是一个根据应用的metrics来进行监控的开源工具。相信很多工程都在使用它来进行监控,有关详细介绍可以查看官网:https://prometheus.io/docs/introduction/overview/。
Grafana是一个开源监控利器,如图所示。
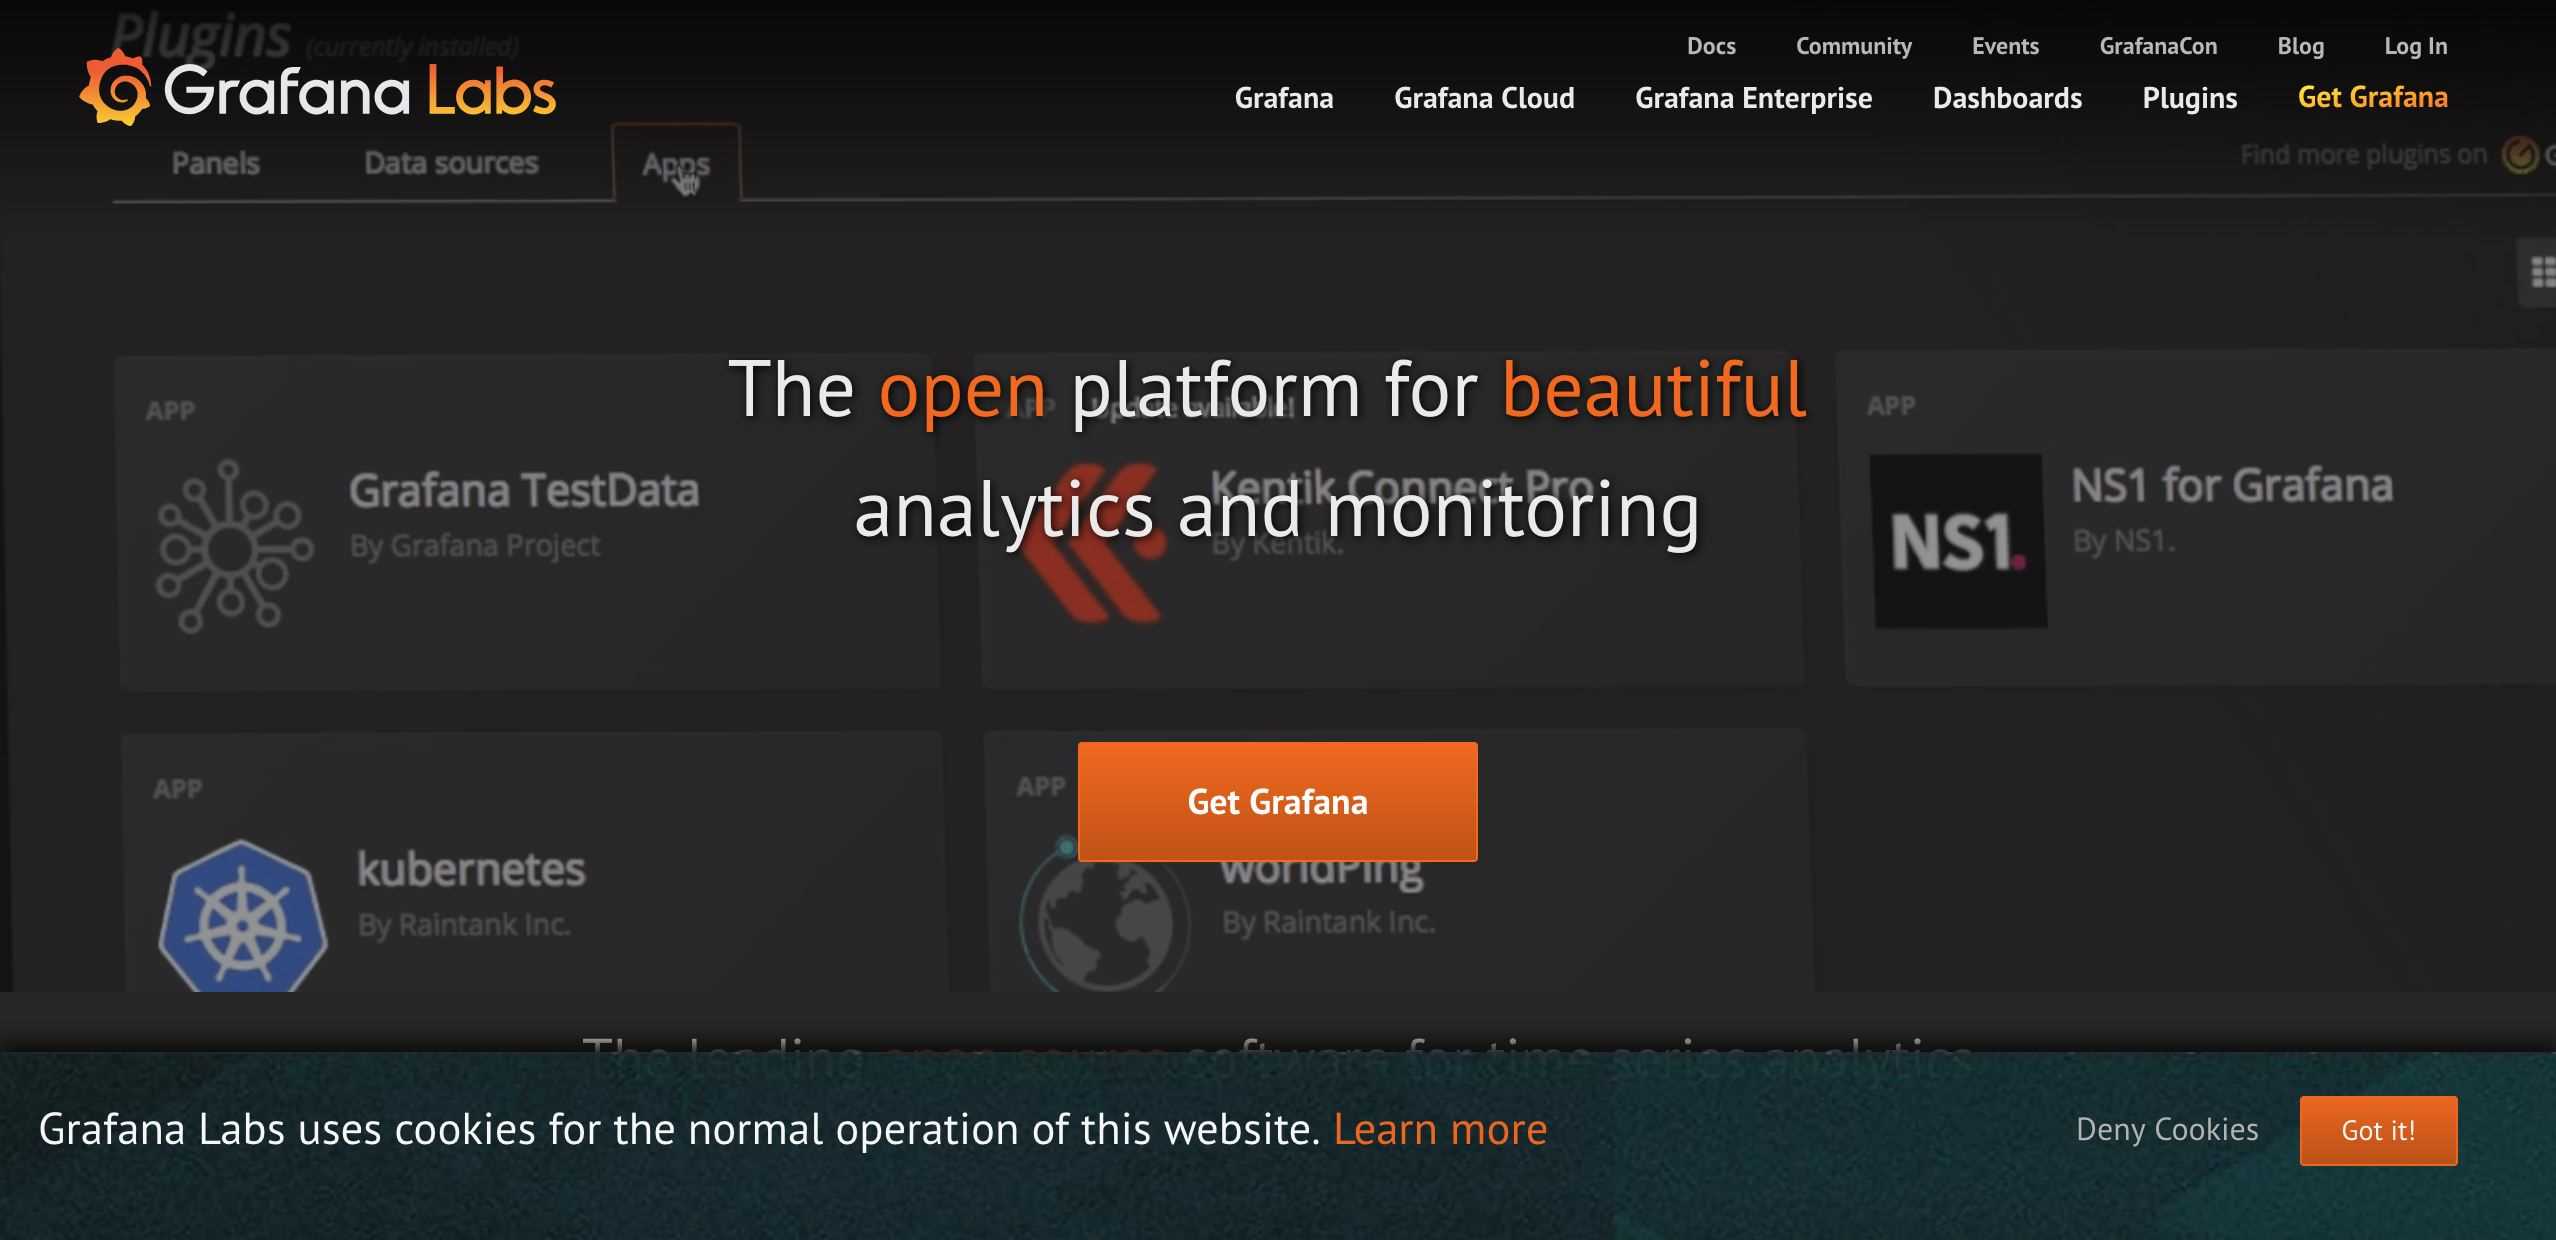
从图中就可以看出来,使用Grafana监控很高大上,提供了很多可视化的图标。
官网地址:Https://grafana.com/
在SpringBoot中使用Prometheus其实很简单,不需要配置太多的东西,在pom文件中加入依赖,完整内容如下所示。
<?xml version="1.0" encoding="UTF-8"?><project xmlns="http://Maven.apache.org/POM/4.0.0" xmlns:xsi="http://www.w3.org/2001/XMLSchema-instance"xsi:schemaLocation="http://maven.apache.org/POM/4.0.0 http://maven.apache.org/xsd/maven-4.0.0.xsd"><modelVersion>4.0.0</modelVersion><parent><groupId>org.springframework.boot</groupId><artifactId>spring-boot-starter-parent</artifactId><version>2.1.3.RELEASE</version><relativePath/> <!-- lookup parent from repository --></parent><groupId>com.dalaoyang</groupId><artifactId>springboot2_prometheus</artifactId><version>0.0.1-SNAPSHOT</version><name>springboot2_prometheus</name><description>springboot2_prometheus</description><properties><java.version>1.8</java.version></properties><dependencies><dependency><groupId>org.springframework.boot</groupId><artifactId>spring-boot-starter-actuator</artifactId></dependency><dependency><groupId>org.springframework.boot</groupId><artifactId>spring-boot-starter-WEB</artifactId></dependency><dependency><groupId>org.springframework.boot</groupId><artifactId>spring-boot-starter-test</artifactId><scope>test</scope></dependency><dependency><groupId>io.micrometer</groupId><artifactId>micrometer-reGIStry-prometheus</artifactId><version>1.1.3</version></dependency></dependencies><build><plugins><plugin><groupId>org.springframework.boot</groupId><artifactId>spring-boot-maven-plugin</artifactId></plugin></plugins></build></project>配置文件中加入配置,这里就只进行一些简单配置,management.metrics.tags.application属性是本文配合Grafana的Dashboard设置的,如下所示:
spring.application.name=springboot_prometheusmanagement.endpoints.web.exposure.include=*management.metrics.tags.application=${spring.application.name}修改启动类,如下所示.
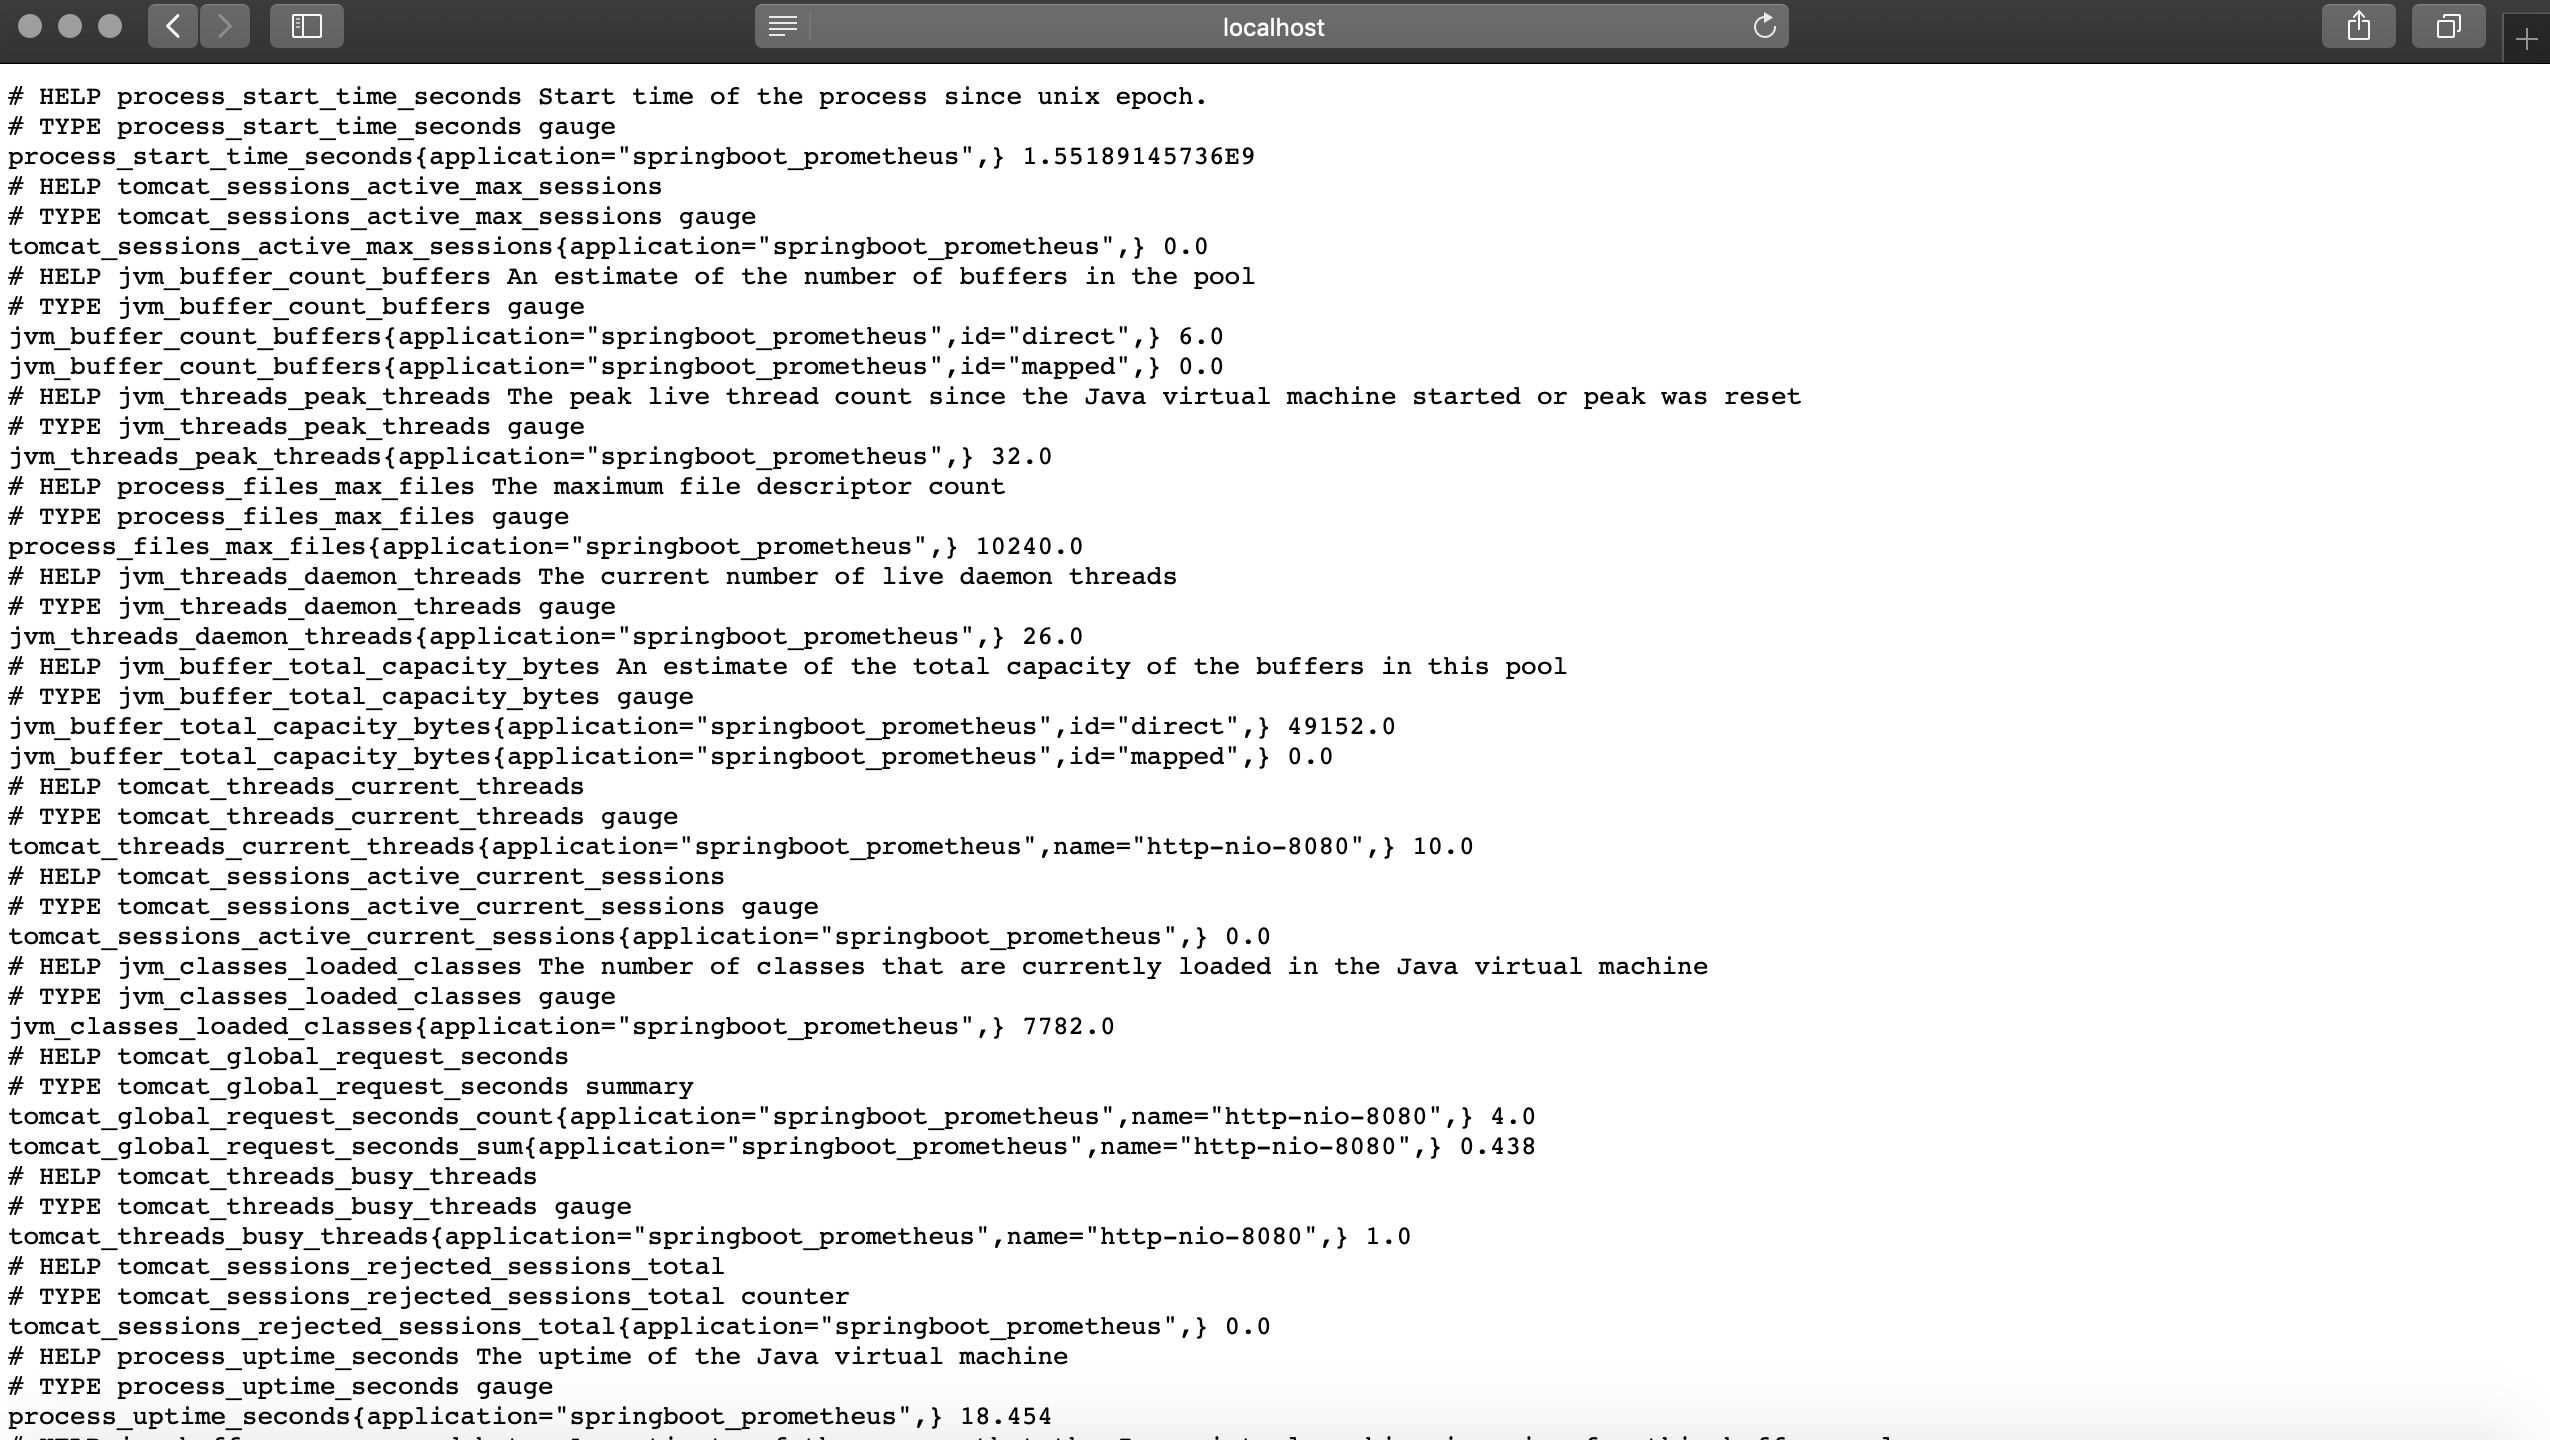
@SpringBootApplicationpublic class Springboot2PrometheusApplication {public static void main(String[] args) {SpringApplication.run(Springboot2PrometheusApplication.class, args);}@BeanMeterRegistryCustomizer<MeterRegistry> configurer(@Value("${spring.application.name}") String applicationName) {return (registry) -> registry.config().commonTags("application", applicationName);}}SpringBoot项目到这里就配置完成了,启动项目,访问http://localhost:8080/actuator/prometheus,如图所示,可以看到一些度量指标。
在prometheus配置监控我们的SpringBoot应用,完整配置如下所示。
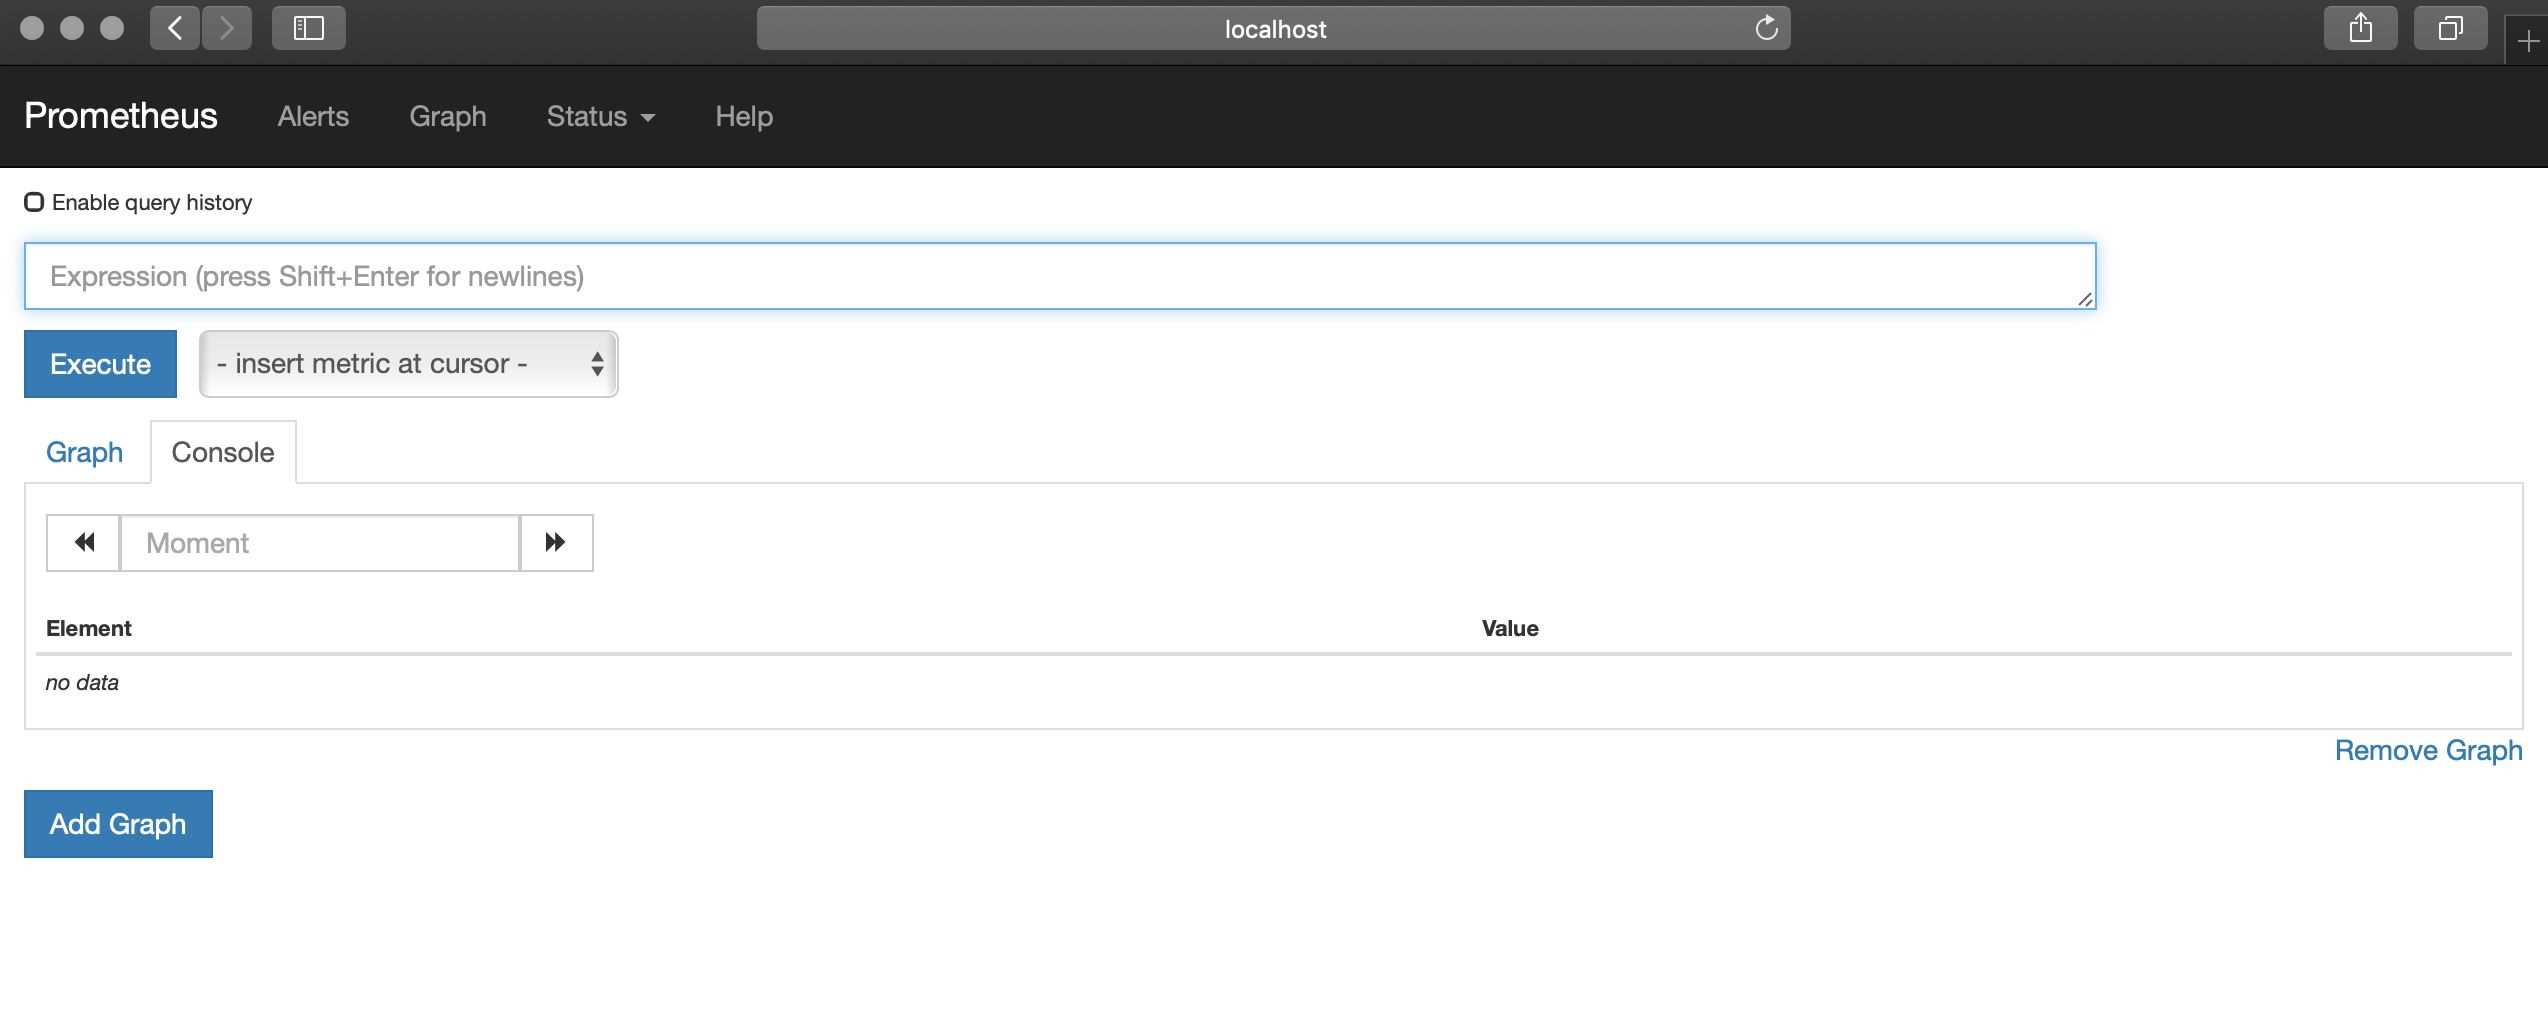
# my global configglobal: scrape_interval: 15s # Set the scrape interval to every 15 seconds. Default is every 1 minute. evaluation_interval: 15s # Evaluate rules every 15 seconds. The default is every 1 minute. # scrape_timeout is set to the global default (10s).# Alertmanager configurationalerting: alertmanagers: - static_configs: - targets: # - alertmanager:9093# Load rules once and periodically evaluate them according to the global 'evaluation_interval'.rule_files: # - "first_rules.yml" # - "second_rules.yml"# A scrape configuration containing exactly one endpoint to scrape:# Here it's Prometheus itself.scrape_configs: - job_name: 'prometheus' static_configs: - targets: ['127.0.0.1:9090']###以下内容为SpringBoot应用配置 - job_name: 'springboot_prometheus' scrape_interval: 5s metrics_path: '/actuator/prometheus' static_configs: - targets: ['127.0.0.1:8080']启动Prometheus,浏览器访问,查看Prometheus页面,如图所示。
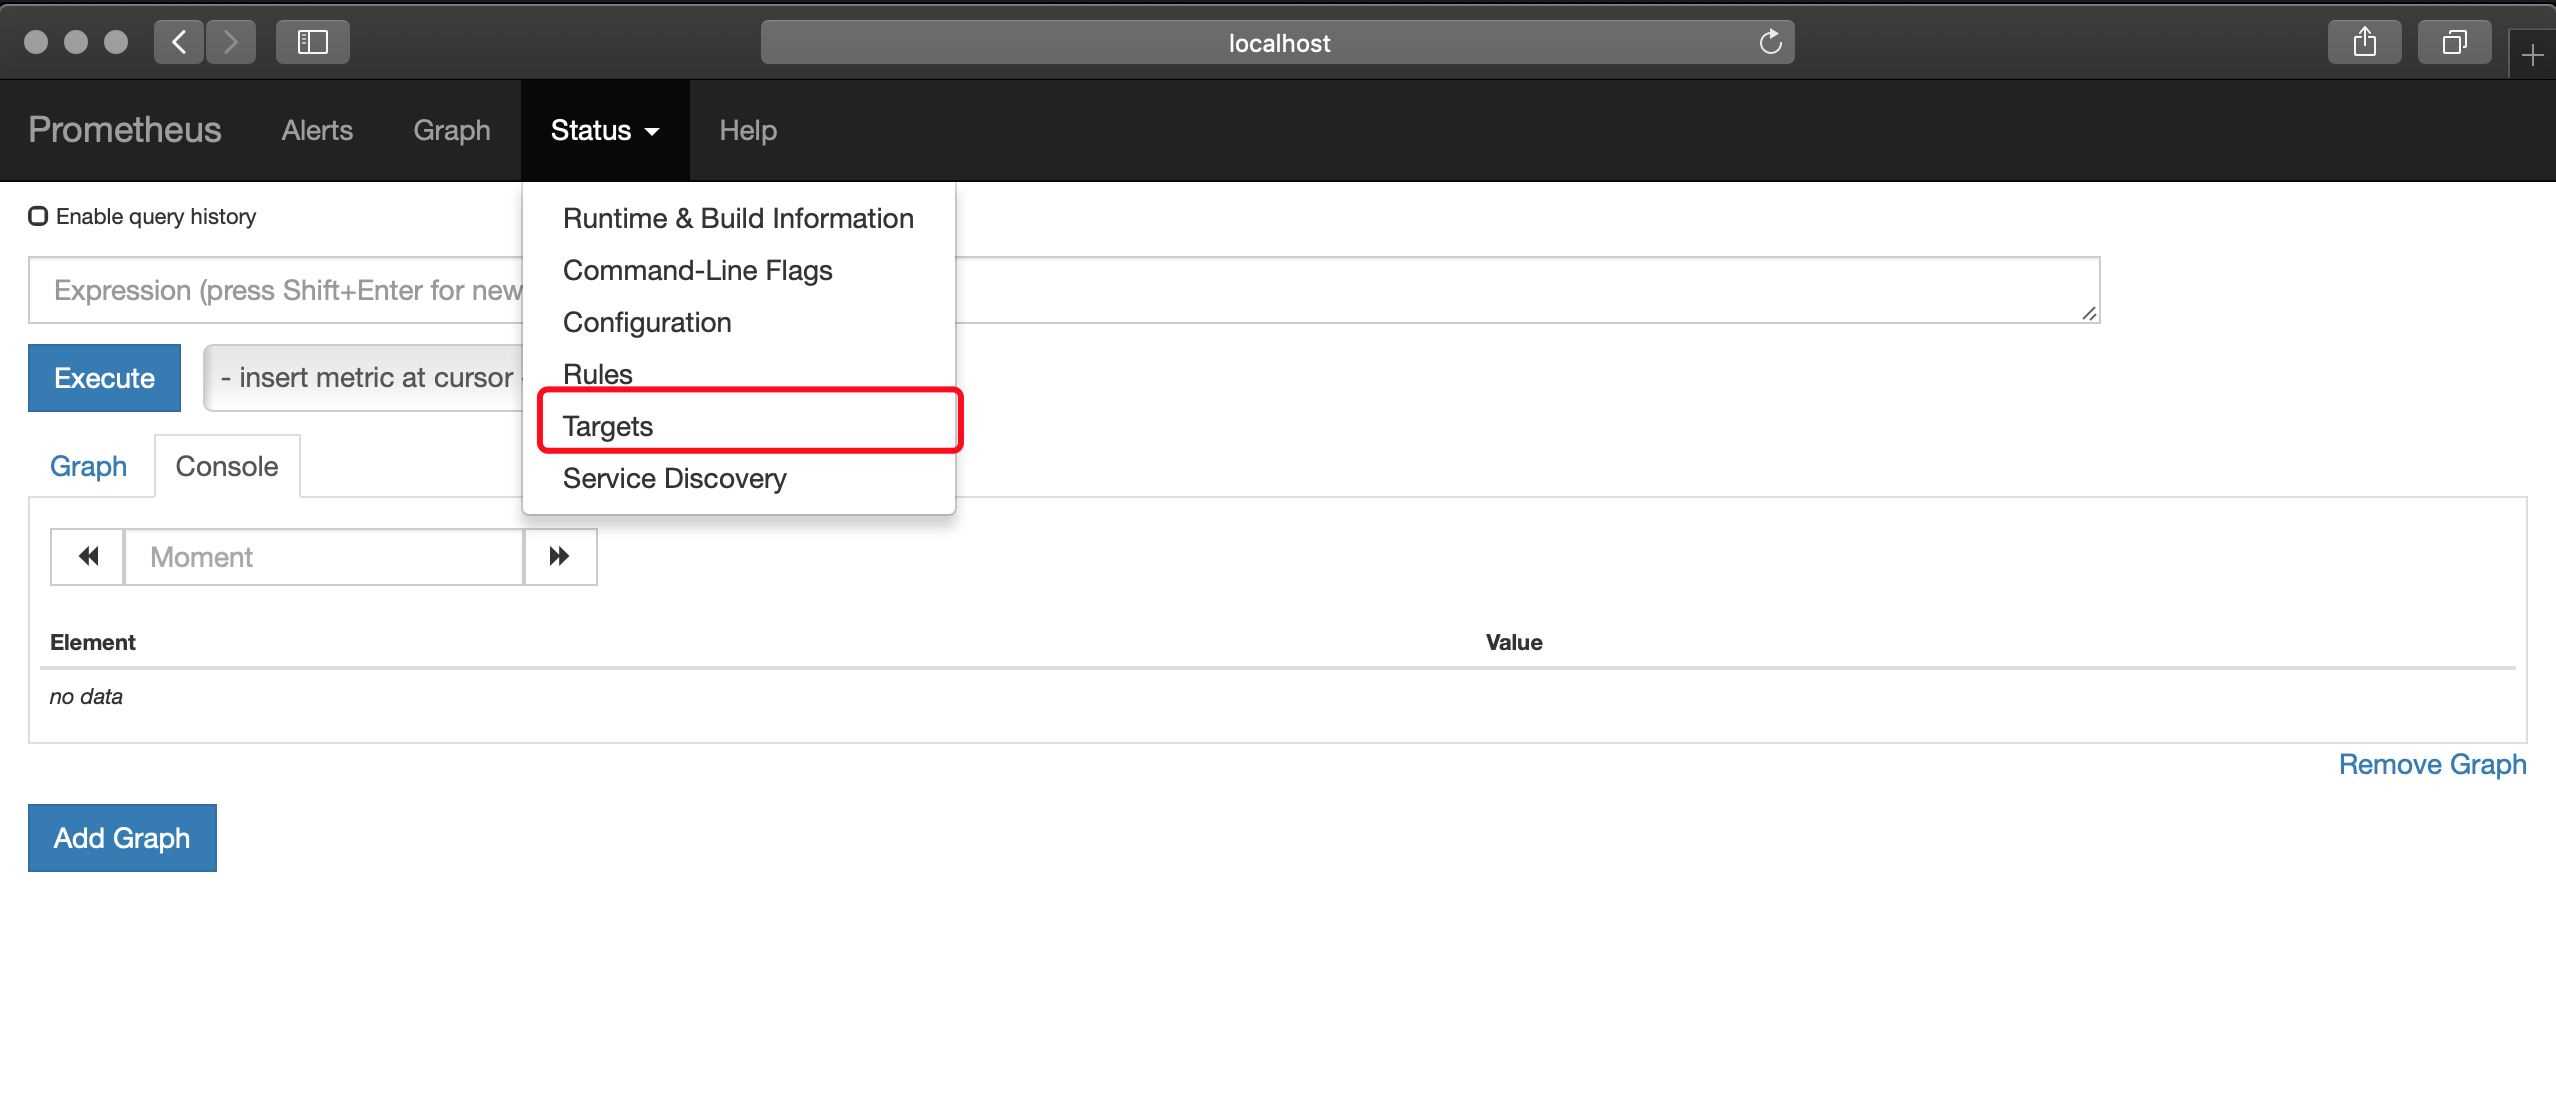
点击如图所示位置,可以查看Prometheus监控的应用。
列表中UP的页面为存活的实例,如图所示。

也可以查看很多指数,如下所示。

启动Grafana,配置Prometheus数据源,这里以ID是4701的Doshboard为例(地址:https://grafana.com/dashboards/4701)如图。

在Grafana内点击如图所示import按钮

在如图所示位置填写4701,然后点击load。

接下来导入Doshboard。
导入后就可以看到我们的SpringBoot项目对应的指标图表了,如图。
以上是“SpringBoot如何使用prometheus监控”这篇文章的所有内容,感谢各位的阅读!希望分享的内容对大家有帮助,更多相关知识,欢迎关注编程网精选频道!
--结束END--
本文标题: SpringBoot如何使用prometheus监控
本文链接: https://www.lsjlt.com/news/268230.html(转载时请注明来源链接)
有问题或投稿请发送至: 邮箱/279061341@qq.com QQ/279061341
下载Word文档到电脑,方便收藏和打印~
2024-04-28
2024-04-28
2024-04-28
2024-04-28
2024-04-28
2024-04-28
2024-04-28
2024-04-28
2024-04-28
2024-04-28
回答
回答
回答
回答
回答
回答
回答
回答
回答
回答


官方手机版

微信公众号

商务合作


0