文章目录 1、配置PHP-FPM,暴露php-fpm状态信息2、bakins/php-fpm-exporter监控PHP应用2.1、配置php状态页的http访问2.2、下载bakins/ph
要监控PHP状态信息,必须先配置显示php状态页,这样prometheus才能通过Exporter进行监控。
官方参考:https://easyengine.io/tutorials/php/fpm-status-page/
修改/usr/local/php/etc/php-fpm.conf,增加以下内容
pm.status_path = /statusping.path = /ping目前可用于监控PHP的Exporter有三个:
本文只介绍前边两个
bakins/php-fpm-exporter只能通过Http读取PHP状态页信息,需要借助Nginx来提供PHP状态页数据
nginx.conf
server { listen 9010; allow 127.0.0.1; #限制ip allow 192.168.28.131; #限制ip deny all; location ~ ^/(status|ping)$ { fastcgi_pass unix:/tmp/php-cgi.sock; # unix Socket #fastcgi_pass 127.0.0.1:9000; # tcp fastcgi_param SCRIPT_FILENAME $document_root$fastcgi_script_name; include fastcgi_params; }}查看状态页数据
[root@ ~]# curl http://127.0.0.1:9010/status# php-fpm状态页的内容如下pool: wwwprocess manager: dynamicstart time: 24/Sep/2022:22:50:44 +0800start since: 2219accepted conn: 42listen queue: 0max listen queue: 0listen queue len: 0idle processes: 12active processes: 1total processes: 13max active processes: 5max children reached: 0slow requests: 0下载地址:https://github.com/bakins/php-fpm-exporter
下载文件:php-fpm-exporter.linux.amd64
mv php-fpm-exporter.linux.amd64 /usr/local/php-fpm-exporterchmod u+x /usr/local/php-fpm-exporter# php-fpm-exporter命令参数usage: php-fpm-exporter []Flags: -h, --help Show context-sensitive help (also try --help-long and --help-man). --addr="127.0.0.1:8080" listen address for metrics handler --endpoint="http://127.0.0.1:9000/status" url for php-fpm status --fastcgi=FASTCGI fastcgi url. If this is set, fastcgi will be used instead of HTTP --WEB.telemetry-path="/metrics" Path under which to expose metrics. Cannot be /# 运行/usr/local/php-fpm-exporter --addr 0.0.0.0:9011 --endpoint="http://127.0.0.1:9010/status" --web.telemetry-path="/metrics" 查看转成Prometheus监控指标的状态页数据
[root@s2 ~]# curl http://127.0.0.1:9011/metricsvi /usr/lib/systemd/system/php_exporter.service
[Unit]Description=php_exporterWants=network-online.targetAfter=network-online.target[Service]User=rootGroup=rootType=simpleExecStart=/usr/local/php-fpm-exporter \ --addr=0.0.0.0:9011 \ --endpoint=http://127.0.0.1:9010/status \ --web.telemetry-path=/metrics[Install]WantedBy=multi-user.targetphp_exporter服务命令
systemctl daemon-reload # 通知systemd重新加载配置文件systemctl enable php_exporter # 设置开机启动systemctl disable php_exporter # 取消开机启动systemctl start php_exporter # 启动服务systemctl restart php_exporter # 重启服务systemctl stop php_exporter # 关闭服务systemctl status php_exporter # 查看状态如果端口未开启,需要开启相关端口
#启动防火墙systemctl start firewalld.service#开通端口firewall-cmd --zone=public --add-port=9011/tcp --permanent#重启防火墙firewall-cmd --reloadprometheus.yml
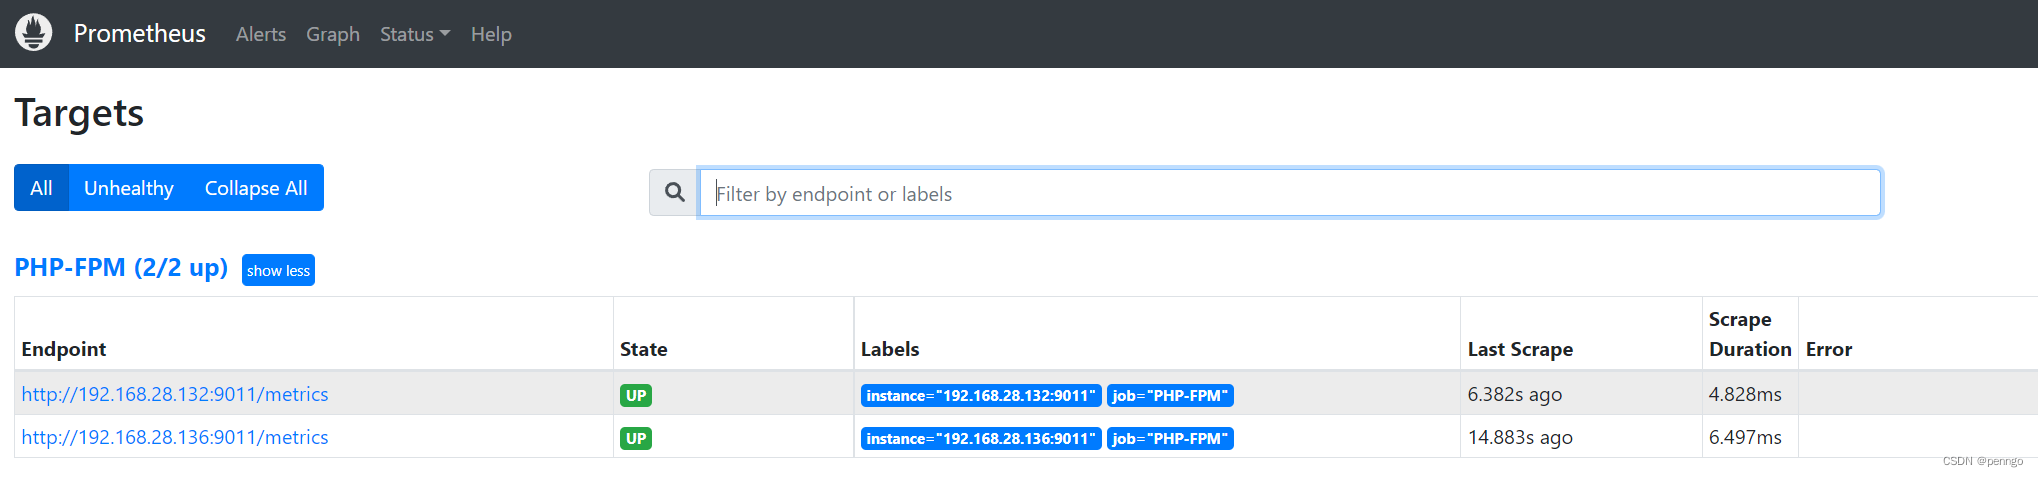
scrape_configs: - job_name: 'PHP-FPM' static_configs: - targets: ['192.168.28.132:9011','192.168.28.136:9011']重新加载配置
curl -X POST http://127.0.0.1:9090/-/reload # prmetheus不需要登录 curl -X POST http://admin@123456:127.0.0.1:9090/-/reload # prmetheus需要登录
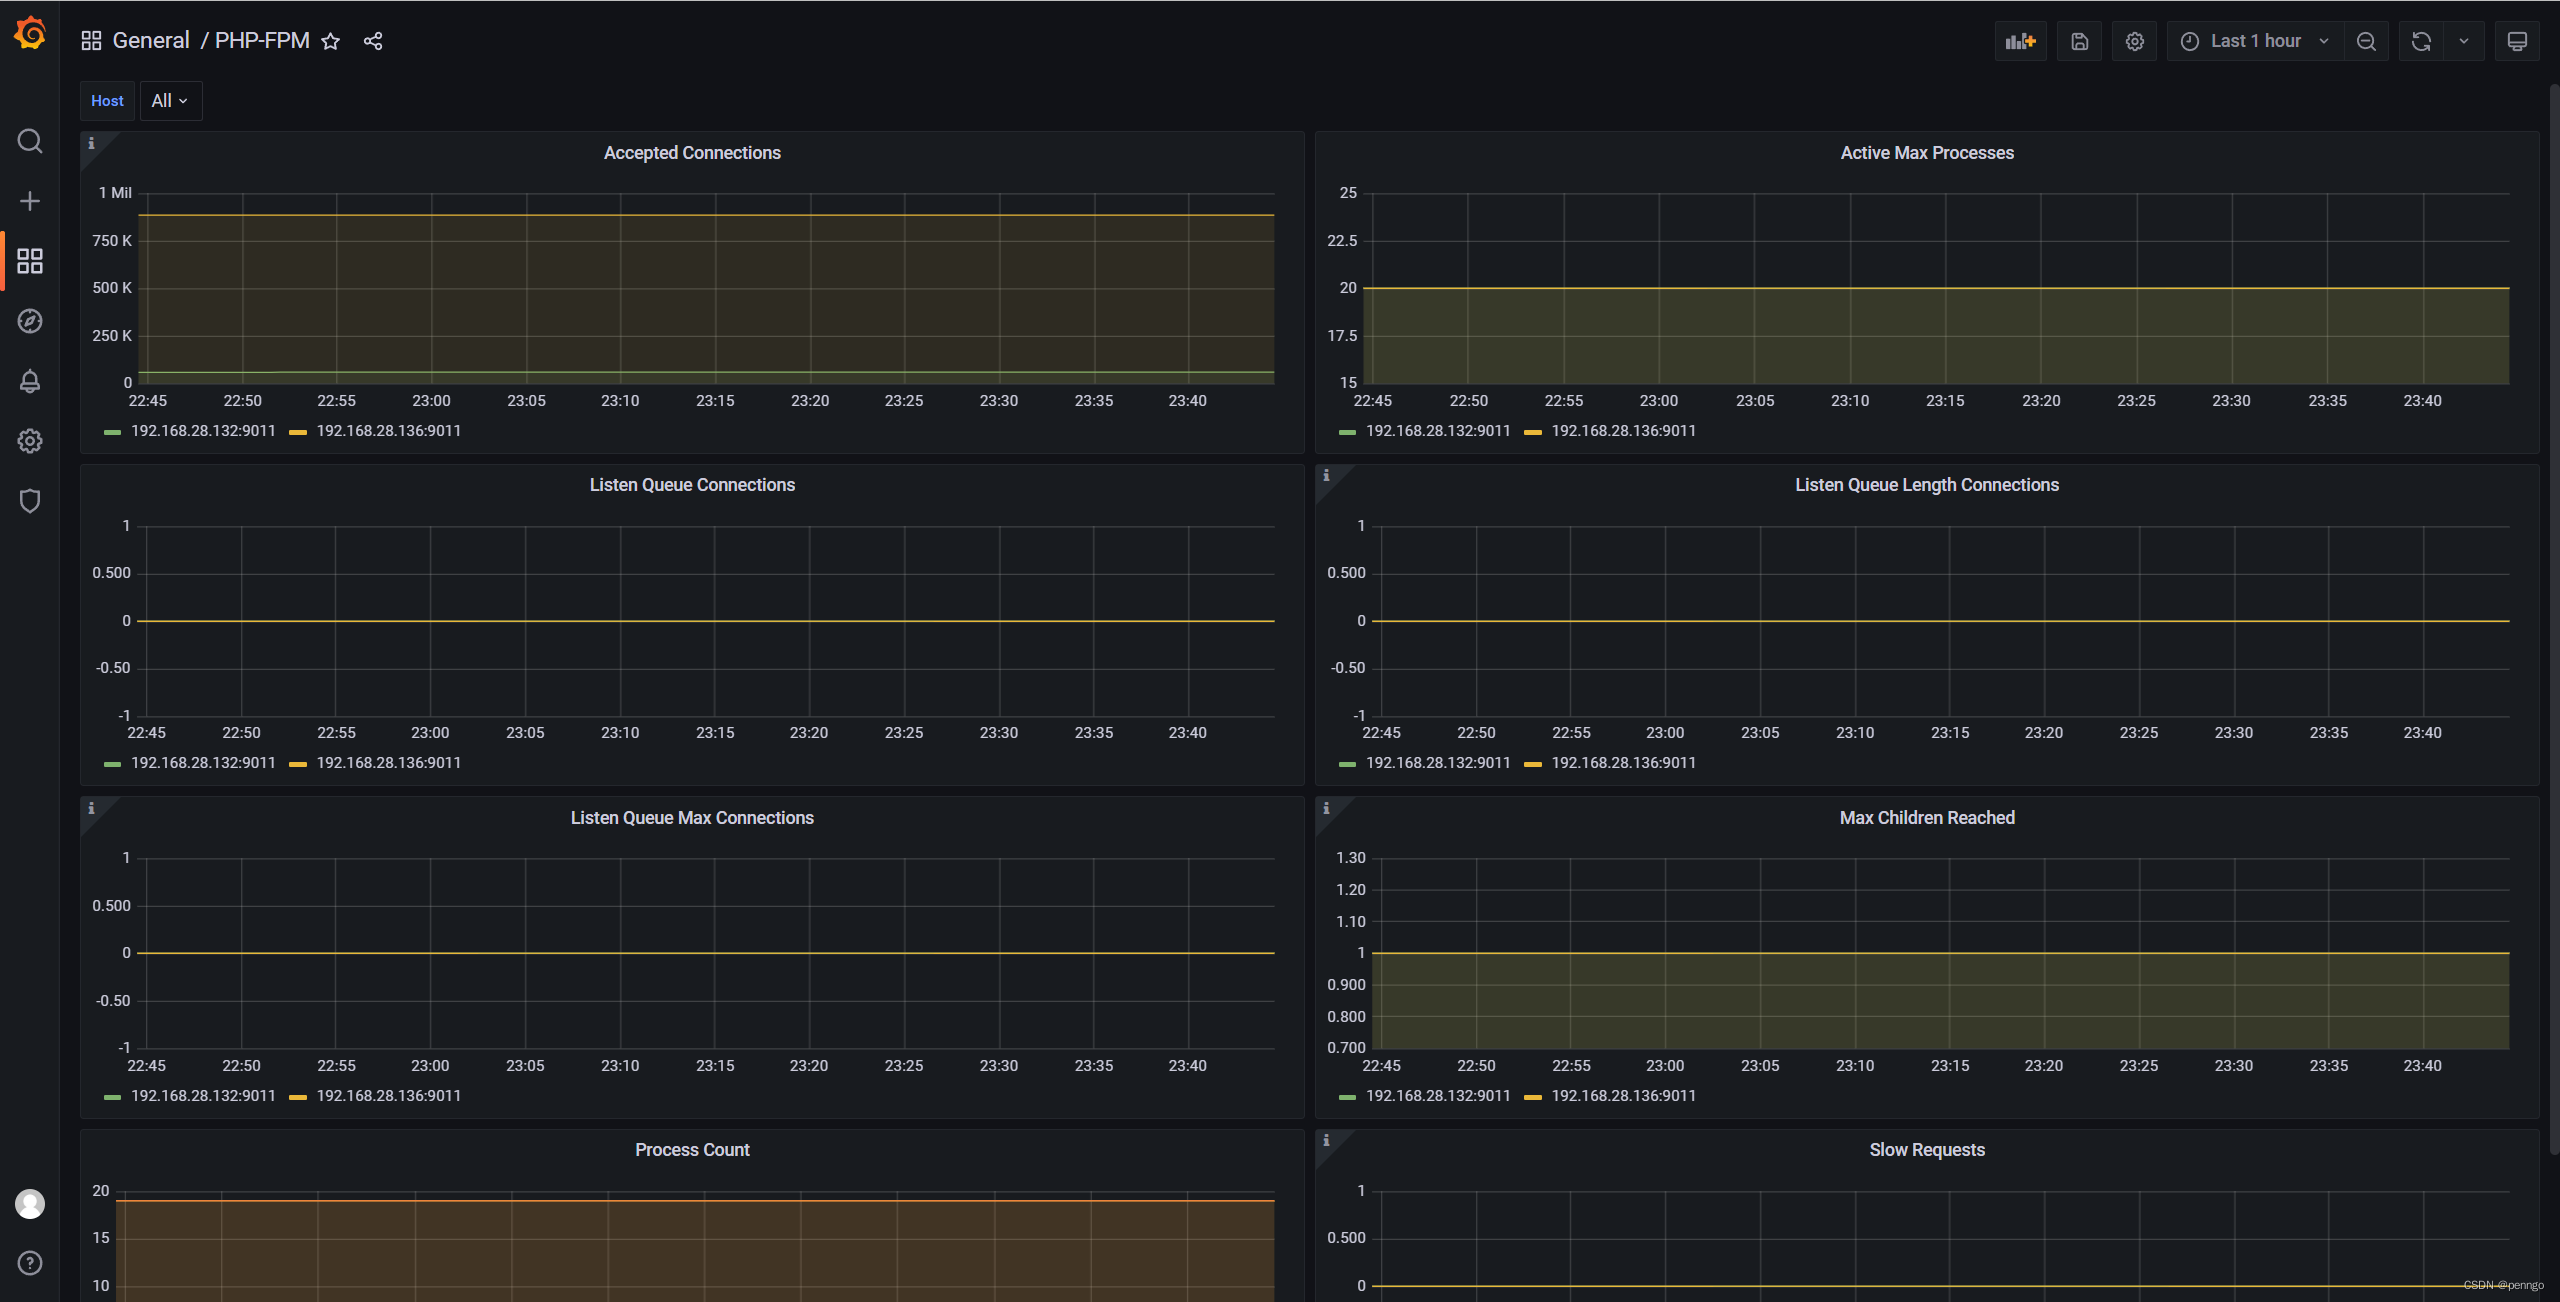
可视化模板:https://grafana.com/grafana/dashboards/3901-php-fpm/
下载:https://github.com/hipages/php-fpm_exporter
下载文件:php-fpm_exporter_2.2.0_linux_amd64
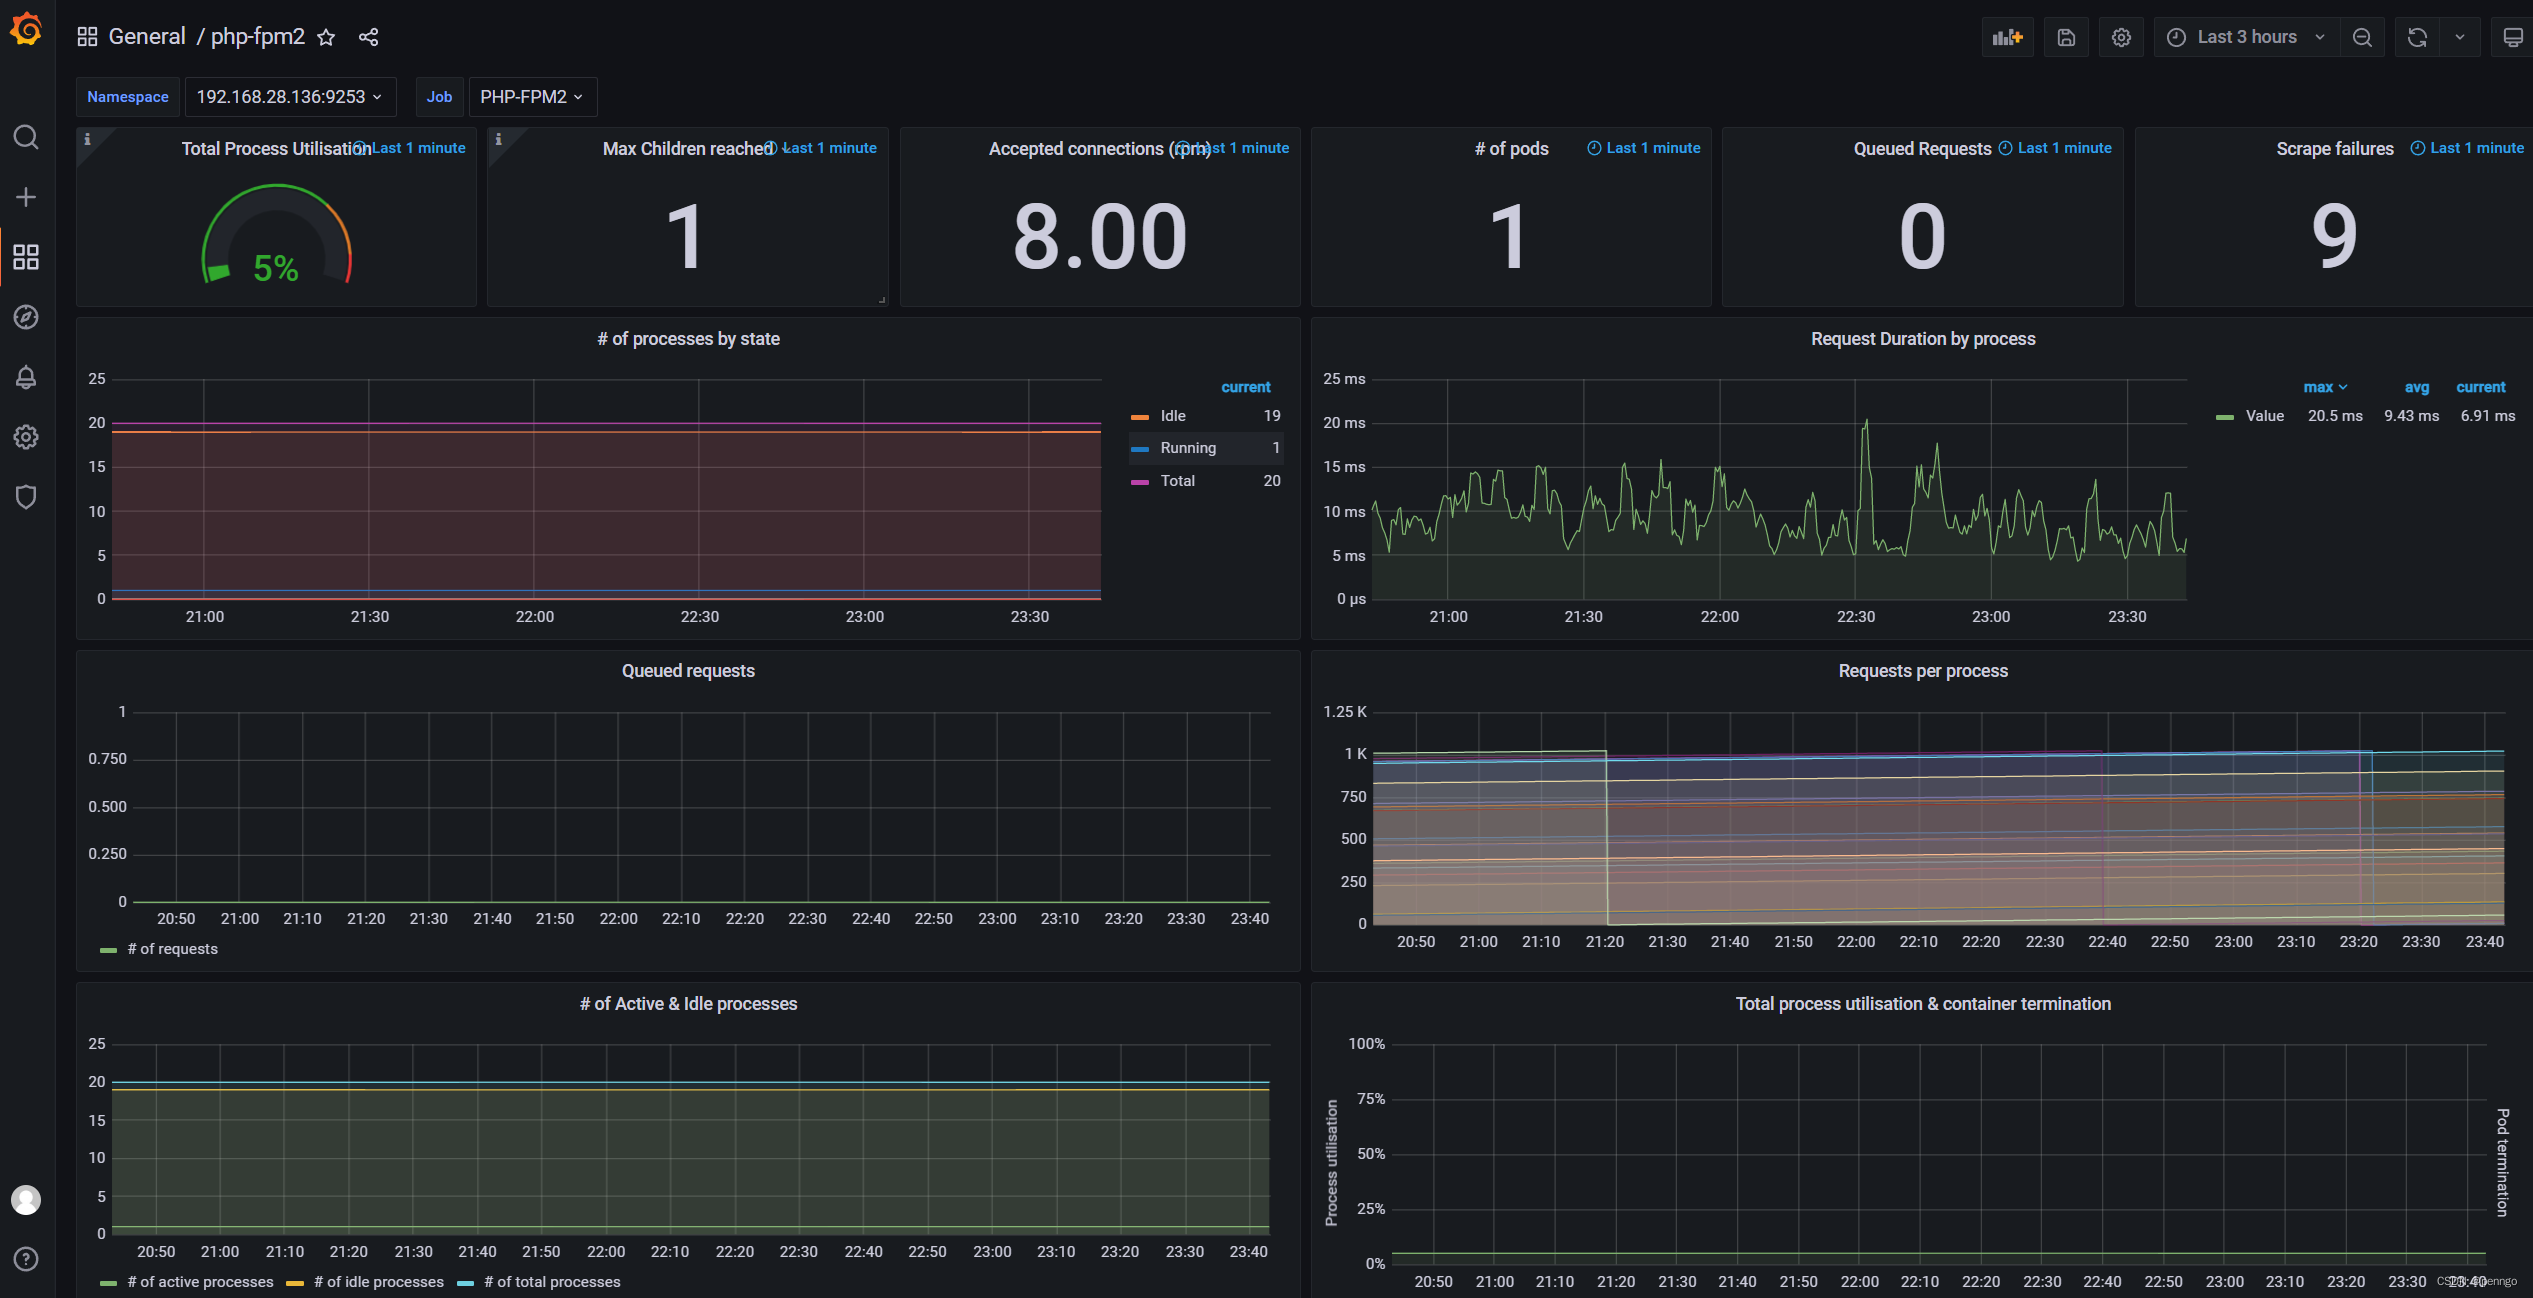
mv php-fpm_exporter_2.2.0_linux_amd64 /usr/local/php-fpm_exporterchmod u+x /usr/local/php-fpm_exporter# 运行命令有两个# get方式是在命令行下显示结果 sudo -u www /usr/local/php-fpm_exporter get --phpfpm.scrape-uri "unix:///tmp/php-cgi.sock;/status"# server方式是以web方式示结果sudo -u www /usr/local/php-fpm_exporter server --web.listen-address ":9253" --phpfpm.scrape-uri "unix:///tmp/php-cgi.sock;/status"# web方式示结果查看监控数据curl http://127.0.0.1:9253/metricsvi /usr/lib/systemd/system/php_exporter2.service
[Unit]Description=php_exporter2Wants=network-online.targetAfter=network-online.target[Service]User=wwwGroup=wwwType=simpleExecStart=/usr/local/php-fpm_exporter server \ --web.listen-address ":9253" \ --web.telemetry-path "/metrics" \ --phpfpm.scrape-uri "unix:///tmp/php-cgi.sock;/status"# --phpfpm.scrape-uri "tcp://127.0.0.1:9000/status"[Install]WantedBy=multi-user.targetphp_exporter2服务命令
systemctl daemon-reload # 通知systemd重新加载配置文件systemctl enable php_exporter2 # 设置开机启动systemctl disable php_exporter2 # 取消开机启动systemctl start php_exporter2 # 启动服务systemctl restart php_exporter2 # 重启服务systemctl stop php_exporter2 # 关闭服务systemctl status php_exporter2 # 查看状态vi /etc/passwd
www:x:1002:1002::/home/www:/sbin/nologin# 修改为www:x:1002:1002::/home/www:/bin/bashscrape_configs: - job_name: 'PHP-FPM2' static_configs: - targets: ['192.168.28.136:9253'] labels: namespace: '192.168.28.136:9253' - targets: ['192.168.28.132:9253'] labels: namespace: '192.168.28.132:9253'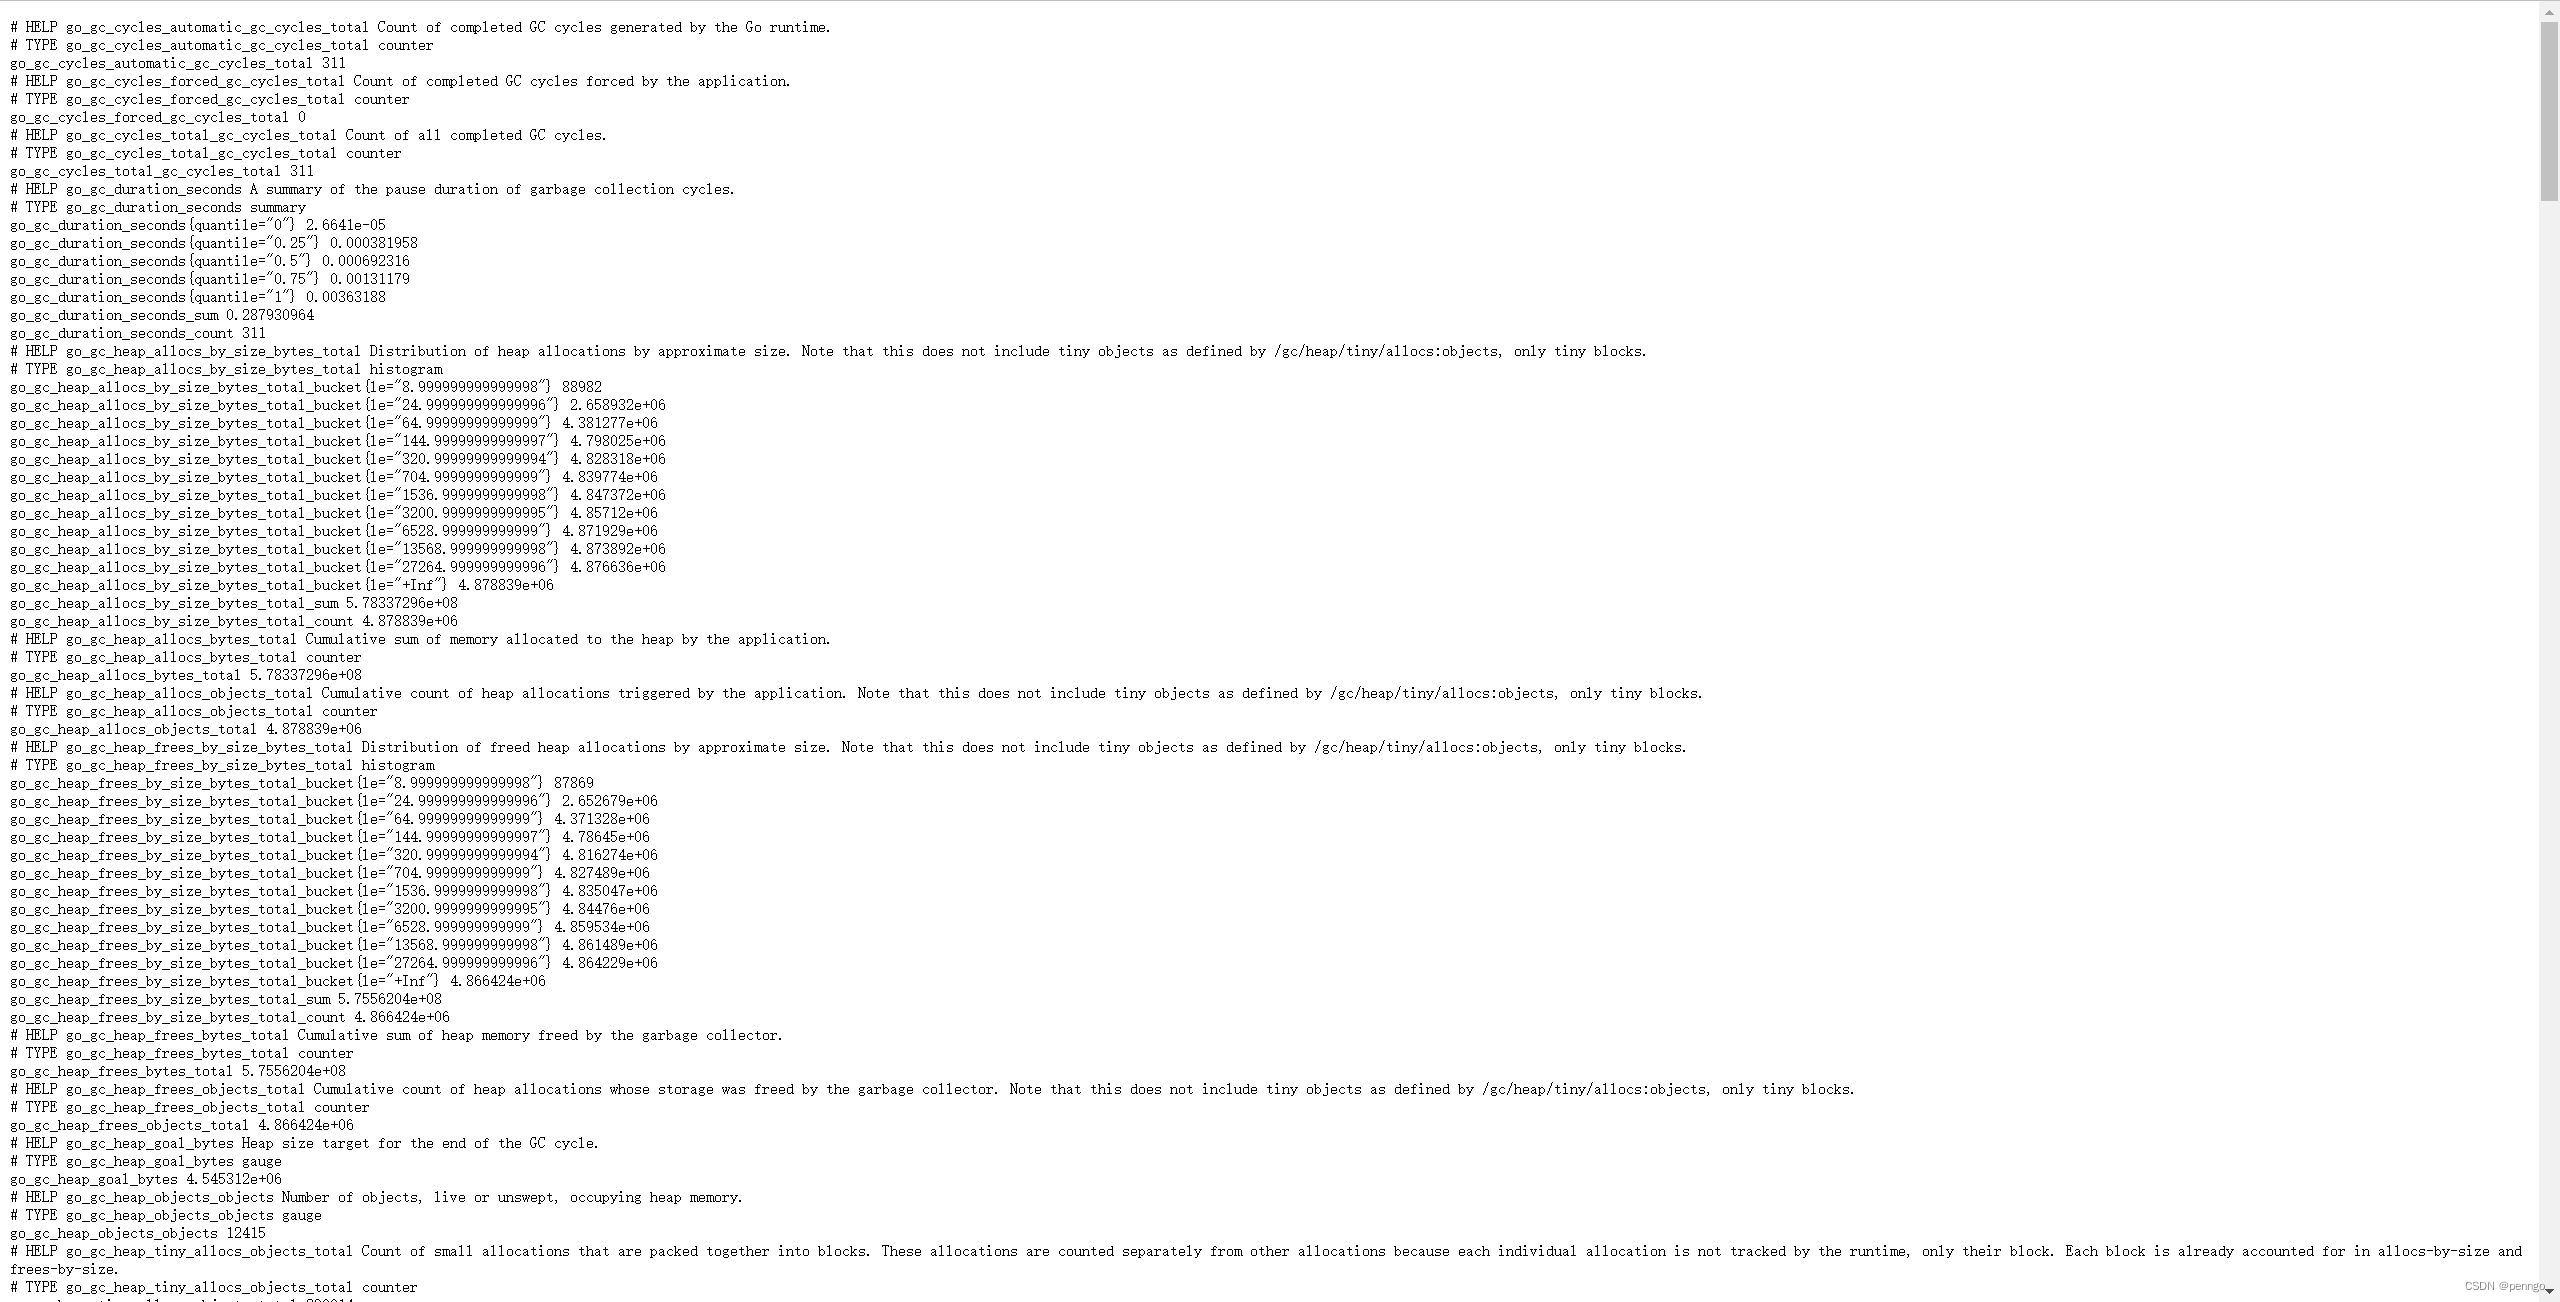

--结束END--
本文标题: Prometheus监控PHP应用
本文链接: https://www.lsjlt.com/news/386828.html(转载时请注明来源链接)
有问题或投稿请发送至: 邮箱/279061341@qq.com QQ/279061341
下载Word文档到电脑,方便收藏和打印~
2024-02-29
2024-02-29
2024-02-29
2024-02-29
2024-02-29
2024-02-29
2024-02-29
2024-02-29
2024-02-29
2024-02-29
回答
回答
回答
回答
回答
回答
回答
回答
回答
回答


官方手机版

微信公众号

商务合作


0