本篇内容介绍了“echarts怎么实现3D柱状图”的有关知识,在实际案例的操作过程中,不少人都会遇到这样的困境,接下来就让小编带领大家学习一下如何处理这些情况吧!希望大家仔细阅读,能够学有所成!echarts实现3d柱状图的两种方式看了不少
本篇内容介绍了“echarts怎么实现3D柱状图”的有关知识,在实际案例的操作过程中,不少人都会遇到这样的困境,接下来就让小编带领大家学习一下如何处理这些情况吧!希望大家仔细阅读,能够学有所成!
看了不少关于3d柱状图的案例,发现做3d柱状图 常用的两种方式就是 自定义图形和象型柱图, 两种实现方式效果如下:
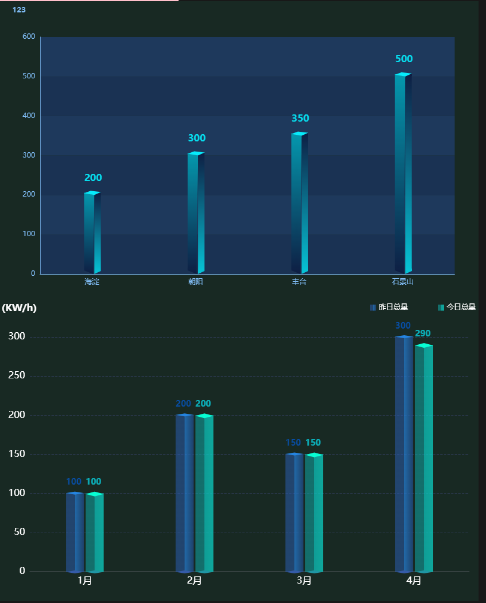
echarts自定义图形的详细用法点这里, 官网点这里, 图中第一个3d柱状图我参考的案例在这里, 看了很多 echarts这种3d案例, 自定义图形做3d柱状图,貌似只能有个柱子(可能 能做双柱,但是 我真的不会)
封装成组件的完整代码如下:
<template></template><script setup lang="ts">import { nextTick, watch } from 'Vue';import echarts from '@/assets/ts/echarts';import useResizeChart from '@/hooks/useResizeChart';function mergeConfig(defaultConfig: object, config: object) { return Object.assign(defaultConfig, config);}function initOption(): echarts.EChartsCoreOption { // 绘制左侧面 const CubeLeft = echarts.graphic.extendShape({ shape: { x: 0, y: 0, }, buildPath: function (ctx, shape) { // 会canvas的应该都能看得懂,shape是从custom传入的 const xAxisPoint = shape.xAxisPoint; const c0 = [shape.x + 3.5, shape.y]; const c1 = [shape.x - 11.5, shape.y - 3]; const c2 = [xAxisPoint[0] - 11.5, xAxisPoint[1] - 6.5]; const c3 = [xAxisPoint[0] + 3.5, xAxisPoint[1]]; ctx.moveTo(c0[0], c0[1]) // @ts-ignore .lineTo(c1[0], c1[1]) .lineTo(c2[0], c2[1]) .lineTo(c3[0], c3[1]) .closePath(); }, }); // 绘制右侧面 const CubeRight = echarts.graphic.extendShape({ shape: { x: 0, y: 0, }, buildPath: function (ctx, shape) { const xAxisPoint = shape.xAxisPoint; const c1 = [shape.x + 3, shape.y]; const c2 = [xAxisPoint[0] + 3, xAxisPoint[1]]; const c3 = [xAxisPoint[0] + 12, xAxisPoint[1] - 7]; const c4 = [shape.x + 12, shape.y - 7]; ctx.moveTo(c1[0], c1[1]) // @ts-ignore .lineTo(c2[0], c2[1]) .lineTo(c3[0], c3[1]) .lineTo(c4[0], c4[1]) .closePath(); }, }); // 绘制顶面 const CubeTop = echarts.graphic.extendShape({ shape: { x: 0, y: 0, }, buildPath: function (ctx, shape) { const c1 = [shape.x + 3.5, shape.y]; const c2 = [shape.x + 12.5, shape.y - 7.5]; //右点 const c3 = [shape.x - 2.5, shape.y - 10]; const c4 = [shape.x - 11.5, shape.y - 3]; ctx.moveTo(c1[0], c1[1]) // @ts-ignore .lineTo(c2[0], c2[1]) .lineTo(c3[0], c3[1]) .lineTo(c4[0], c4[1]) .closePath(); }, }); // 注册三个面图形 echarts.graphic.reGISterShape('CubeLeft', CubeLeft); echarts.graphic.registerShape('CubeRight', CubeRight); echarts.graphic.registerShape('CubeTop', CubeTop); const VALUE = props.value; const series = [ { type: 'custom', renderItem: (params: any, api: any) => { let cubeLeftStyle = new echarts.graphic.LinearGradient(0, 0, 0, 1, [ { offset: 0, // @ts-ignore color: props.color[0], }, { offset: 1, color: 'rgba(7, 20, 52,0.7)', }, ]); let cubeRightStyle = new echarts.graphic.LinearGradient(0, 0, 0, 1, [ { offset: 0, color: 'rgba(7, 20, 52,1)', }, { offset: 1, // @ts-ignore color: props.color[0], }, ]); let cubeTopStyle = new echarts.graphic.LinearGradient(0, 0, 0, 1, [ { offset: 0, // @ts-ignore color: props.color[1] || props.color[0], }, ]); const location = api.coord([api.value(0), api.value(1)]); return { type: 'group', children: [ { type: 'CubeLeft', shape: { api, xValue: api.value(0), yValue: api.value(1), x: location[0], y: location[1], xAxisPoint: api.coord([api.value(0), 0]), }, style: { fill: cubeLeftStyle, }, }, { type: 'CubeRight', shape: { api, xValue: api.value(0), yValue: api.value(1), x: location[0], y: location[1], xAxisPoint: api.coord([api.value(0), 0]), }, style: { fill: cubeRightStyle, }, }, { type: 'CubeTop', shape: { api, xValue: api.value(0), yValue: api.value(1), x: location[0], y: location[1], xAxisPoint: api.coord([api.value(0), 0]), }, style: { fill: cubeTopStyle, }, }, ], }; }, data: VALUE, }, { type: 'bar', label: { show: true, position: 'top', fontSize: 14, color: props.color[0], offset: [2, -10], }, itemStyle: { color: 'transparent', }, tooltip: {}, data: VALUE, }, ]; const title = mergeConfig( { text: '', textStyle: { color: props.color[0], fontWeight: '800', fontSize: 12, }, left: '18px', top: '1%', }, props.title, ); const XAxisLine = mergeConfig( { show: false, lineStyle: { type: 'solid', width: 1, color: '#2c3954', }, }, props.XAxisLine, ); const YAxisLine = mergeConfig( { show: false, lineStyle: { show: true, lineStyle: { type: 'solid', width: 1, }, }, }, props.YAxisLine, ); const legend = mergeConfig( { show: true, left: 'center', top: '95%', icon: 'circle', textStyle: { color: '#fff', }, }, props.legend, ); const grid = mergeConfig( { left: '5%', right: '5%', top: '12%', bottom: '0%', containLabel: true, }, props.grid, ); const XSplitLine = mergeConfig( { show: false, lineStyle: { type: 'dashed', width: 1, }, }, props.XSplitLine, ); // 纵坐标分割线配置 const YSplitLine = mergeConfig( { // 是否显示 // show: false, show: true, // 样式 lineStyle: { color: '#13263e', type: 'solid', width: 1, }, }, props.YSplitLine, ); const XAxisTick = mergeConfig( { show: false, length: 5, inside: true, alignWithLabel: true, lineStyle: { type: 'solid', width: 1, }, }, props.XAxisTick, ); const YAxisTick = mergeConfig( { show: true, length: 5, inside: true, alignWithLabel: true, lineStyle: { color: '#13263e', type: 'solid', width: 1, }, }, props.YAxisTick, ); let option: echarts.EChartsCoreOption = { title, tooltip: { show: false, // 指示器提示的坐标轴 trigger: 'axis', // 阴影提示器 axisPointer: { type: 'shadow', shadowStyle: { shadowColor: '#2e3e51', // 设置阴影的颜色 }, }, fORMatter: function (params: any) { const item = params[1]; return item.name + ' : ' + item.value; }, // 提示框背景颜色 backgroundColor: '#122843', // 提示框边框颜色 borderColor: '#42D1F1', // 提示框文本样式 textStyle: { color: '#fff', }, }, legend: legend, grid: grid, xAxis: { type: 'cateGory', // boundaryGap: false, data: props.xAxisData, axisLine: XAxisLine, splitLine: XSplitLine, axisTick: XAxisTick, axisLabel: { //x轴文字的配置 show: true, color: '#fff', fontSize: 12, rotate: 30, }, }, yAxis: { type: 'value', name: props.yUnit, nameTextStyle: { color: '#fff', fontSize: 16, }, axisLine: YAxisLine, splitLine: YSplitLine, axisTick: YAxisTick, axisLabel: { //y轴文字的配置 color: '#fff', fontSize: 12, }, }, series, }; option = Object.assign(option, props.config); return option;}const props = defineProps({ pid: { type: String, required: true, }, title: { type: Object, default: {}, }, xAxisData: { type: Array, required: true, }, legend: { type: Object, default: {}, }, grid: { type: Object, default: {}, }, XAxisLine: { type: Object, default: {}, }, YAxisLine: { type: Object, default: {}, }, yUnit: { type: String, default: '', }, XSplitLine: { type: Object, default: {}, }, YSplitLine: { type: Object, default: {}, }, XAxisTick: { type: Object, default: {}, }, YAxisTick: { type: Object, default: {}, }, config: { type: Object as () => echarts.EChartsCoreOption, default: {}, }, value: { type: Array, required: true, }, // 柱子的颜色 color: { type: Array, default: ['rgba(29, 230, 235,1)', 'rgba(7, 235, 251,1)'], },});let option = initOption();let container: htmlElement | null = null;let myChart: echarts.ECharts | null = null;const renderChart = (notMerge: boolean = false) => { if (!myChart) myChart = echarts.init(container as HTMLElement); myChart.setOption(option, { notMerge, });};nextTick(() => { container = document.querySelector('#' + props.pid) as HTMLElement; renderChart(); useResizeChart(container, myChart as echarts.ECharts);});watch( () => props, (newVal, oldVal) => { let notMerge = true; option = initOption(); renderChart(notMerge); }, { deep: true, },);function exportImg() { const src = (myChart as echarts.ECharts).getDataURL({ pixelRatio: 2, backgroundColor: '#08172A', }); const a = document.createElement('a'); a.href = src; a.download = (option.title as { text: string }).text || 'chart-img'; a.click();}defineExpose({ exportImg,});</script><style lang="sCSS" scoped></style>echarts象型柱图的官网配置项点这里, 参考的案例在这里, 象型柱图可以单柱可以双柱
封装成组件的完整代码如下:
<template></template><script setup lang="ts">import { nextTick, watch } from "vue";import echarts from "@/assets/ts/echarts";import { LegendComponent } from "echarts/components";echarts.use([LegendComponent]);// 合并配置方法function mergeConfig(defaultConfig: object, config: object) { return Object.assign(defaultConfig, config);}function initOption(): echarts.EChartsCoreOption { // 此时 使用组件只需要要将 zzx1的数据和 wgx1 的数据传递到子组件 // 第一个柱子的值 const zzx1 = props.series[0].data; // 实际值 // 第二个柱子的值 const wgx1 = props.series[1].data; // 变量: 改变每个柱子的大小, 后期可将其设置为动态的? const barWidth = 30; const series = [ // (0)第一个柱子 中间的正方形 { type: "pictorialBar", // 象型柱状 symbol: "diamond", symbolSize: [barWidth, 5], // 调整大小 // symbolOffset: [-13, -3], // 图形相对于原本位置的偏移 symbolOffset: ["-55%", -3], // 图形相对于原本位置的偏移 symbolPosition: "end", z: 12, color: "#2584e0", data: zzx1, }, // (1)第二个柱子中间的正方形 { type: "pictorialBar", symbol: "diamond", symbolSize: [barWidth, 8], // symbolOffset: [13, -3], symbolOffset: ["55%", -3], symbolPosition: "end", z: 12, color: "#07fdd3", data: wgx1, }, // (2)第一个柱子 底部的正方形 { type: "pictorialBar", symbol: "diamond", symbolSize: [barWidth, 5], // symbolOffset: [-13, 3], symbolOffset: ["-55%", 3], z: 12, color: "#355ba8", data: zzx1, }, // (3)第二个柱子 底部的正方形 { name: "", type: "pictorialBar", symbol: "diamond", symbolSize: [barWidth, 5], // symbolOffset: [13, 3], symbolOffset: ["55%", 3], color: "#2095a3", z: 12, data: wgx1, }, // (4)一个柱子, 下方有颜色填充的的柱子 { name: props.nameOne, type: "bar", barWidth: barWidth, barGap: "10%", // zlevel: 2, stack: "1", itemStyle: { opacity: 0.7, color: new echarts.graphic.LinearGradient(0, 0, 1, 0, [ { offset: 0.5, color: "rgba(44, 97, 188,0.7)", // color: '#2c61bc', }, { offset: 0.5, color: "#2584e0", }, { offset: 1, color: "#214a87", }, ]), // barBorderRadius: 0, borderRadius: 0, }, // 是否在每个柱子显示 相应的值 label: { show: true, position: ["0", "-25"], color: "#005dd9", fontSize: 14, fontWeight:'bold' }, data: zzx1, }, // (5)第二个柱子, 下方有颜色填充的的柱子 { name: props.nameTow, type: "bar", stack: "2", barWidth: barWidth, itemStyle: { opacity: 0.7, color: new echarts.graphic.LinearGradient(0, 0, 1, 0, [ { offset: 0.5, color: "rgba(15, 182, 182,0.7)", }, { offset: 0.5, color: "#0ccec7", }, { offset: 1, color: "#0bDDD0", }, ]), // barBorderRadius: 0, borderRadius: 0, }, // 是否在每个柱子显示 相应的值 label: { show: true, position: ["0", "-25"], color: "#06e6f6", fontSize: 14, fontWeight:'bold' }, data: wgx1, }, ]; // title 配置 const title = mergeConfig( { // 是否显示 show: true, // title 文本 text: "", top: 0, left: "left", // 文字样式 textStyle: { color: "#fff", fontSize: 16, }, }, props.title ); // 横坐标轴线配置 const XAxisLine = mergeConfig( { // 是否显示 show: true, // show: false, // 样式 lineStyle: { // color: "rgba(46, 60, 87)", type: "solid", width: 1, }, }, props.XAxisLine ); // 纵坐标轴线配置 const YAxisLine = mergeConfig( { // 是否显示 // show: true, show: false, // 样式 lineStyle: { // 是否显示 show: true, // 样式 lineStyle: { color: "#fff", type: "solid", width: 1, }, }, }, props.YAxisLine ); // 横坐标分割线配置 const XSplitLine = mergeConfig( { // 是否显示 show: false, // 样式 lineStyle: { color: "#fff", type: "dotted", width: 1, }, }, props.XSplitLine ); // 纵坐标分割线配置 const YSplitLine = mergeConfig( { // 是否显示 show: true, // 样式 lineStyle: { color: "rgba(46, 59, 86)", type: 'dashed', // type: "solid", width: 1, }, }, props.YSplitLine ); // 横坐标刻度配置 const XAxisTick = mergeConfig( { // 是否显示 show: false, // 刻度长度 length: 5, // 是否朝内 inside: true, // 刻度是否居中 alignWithLabel: true, // 样式 lineStyle: { color: "#fff", type: "solid", width: 1, }, }, props.XAxisTick ); // 纵坐标刻度配置 const YAxisTick = mergeConfig( { // 是否显示 show: false, // 刻度长度 length: 5, // 是否朝内 inside: true, // 刻度是否居中 alignWithLabel: true, color: "#fff", // 样式 lineStyle: { color: "#fff", type: "solid", width: 1, }, }, props.YAxisTick ); // 图例标记配置 const legend = mergeConfig( { show: true, right: "0", top: "0", icon: "rect", itemHeight: 10, itemWidth: 10, textStyle: { color: "#fff", }, // 取消默认点击事件 selectedMode: false, // 距离 itemGap: 50, }, props.legend ); // 指示器: const tooltip = { show: false, trigger: "axis", axisPointer: { type: "shadow", }, formatter: function (e: any) { // console.log(e); var str = e[4].axisValue + "<br>" + "<span style='display:inline-block;margin-right:5px;border-radius:10px;width:10px;height:10px;background-color:" + e[4].color.colorStops[0].color + ";'></span>" + "" + e[4].seriesName + " : " + e[4].value + "<br>" + "<span style='display:inline-block;margin-right:5px;border-radius:10px;width:10px;height:10px;background-color:" + e[5].color.colorStops[0].color + ";'></span>" + "" + e[5].seriesName + " : " + e[5].value; return str; }, // 提示框背景颜色 backgroundColor: "#122843", // 提示框边框颜色 borderColor: "#42D1F1", // 提示框文本样式 textStyle: { color: "#fff", }, }; // 汇总配置 let option: echarts.EChartsCoreOption = { title, tooltip, legend, grid: { top: "12%", left: "2%", right: "2%", bottom: "5%", // height: "85%", containLabel: true, }, xAxis: { type: "category", boundaryGap: true, data: props.xAxisData, axisLine: XAxisLine, splitLine: XSplitLine, axisTick: XAxisTick, axisLabel: { // textStyle: { color: "#fff", fontSize:16 // }, }, }, yAxis: { type: "value", // 单位 name: props.yUnit, axisLine: YAxisLine, splitLine: YSplitLine, axisTick: YAxisTick, axisLabel: { // textStyle: { color: "#fff", fontSize:16 // }, }, min: 0, // max: props.max, }, series, }; // 合并配置生成最终配置 option = Object.assign(option, props.config); return option;}// propsconst props = defineProps({ // 父容器ID pid: { type: String, required: true, }, title: { type: Object, default: {}, }, // 数据 series: { // type: Array as () => Array<BarSeriesOption>, type: Array as () => { data: number[] }[], required: true, }, // 横坐标 xAxisData: { type: Array, required: true, }, // 图例标记 legend: { type: Object, default: {}, }, // 横坐标轴线 XAxisLine: { type: Object, default: {}, }, // 纵坐标轴线 YAxisLine: { type: Object, default: {}, }, // y轴单位 yUnit: { type: String, default: "", }, // 横坐标分割线 XSplitLine: { type: Object, default: {}, }, // 纵坐标分割线 YSplitLine: { type: Object, default: {}, }, // 横坐标刻度 XAxisTick: { type: Object, default: {}, }, // 纵坐标刻度 YAxisTick: { type: Object, default: {}, }, // 总配置,将与默认配置与用户传入的配置合并 config: { type: Object as () => echarts.EChartsCoreOption, default: {}, }, // 最值 // max: { // type: Number, // // requird: true, // default: 5000, // }, nameOne: { type: String, default: "昨日总量", }, nameTow: { type: String, default: "今日总量", },});// optionlet option = initOption();// chart 容器let container: HTMLElement | null = null;// chart 实例let myChart: echarts.ECharts | null = null;// 渲染方法const renderChart = () => { if (!myChart) myChart = echarts.init(container as HTMLElement); myChart.setOption(option);};// DOM加载后渲染 chartnextTick(() => { // 获取容器 container = document.querySelector("#" + props.pid) as HTMLElement; // 渲染 chart renderChart(); // 自适应 chart // useResizeChart(container, myChart as echarts.ECharts);});// 监听 props 变化watch( () => props, () => { // 更新 option option = initOption(); // 重新渲染chart renderChart(); }, { deep: true, });// 导出为图片function exportImg() { // 生成 base64 图片 const src = (myChart as echarts.ECharts).getDataURL({ pixelRatio: 2, backgroundColor: "#08172A", }); // 下载 const a = document.createElement("a"); a.href = src; a.download = (option.title as { text: string }).text || "chart-img"; a.click();}// 暴露出 chart 图片导出方法,父组件可以通过实例调用defineExpose({ exportImg,});</script><style lang="scss" scoped></style>“echarts怎么实现3d柱状图”的内容就介绍到这里了,感谢大家的阅读。如果想了解更多行业相关的知识可以关注编程网网站,小编将为大家输出更多高质量的实用文章!
--结束END--
本文标题: echarts怎么实现3d柱状图
本文链接: https://www.lsjlt.com/news/349793.html(转载时请注明来源链接)
有问题或投稿请发送至: 邮箱/279061341@qq.com QQ/279061341
下载Word文档到电脑,方便收藏和打印~
2024-05-16
2024-05-16
2024-05-16
2024-05-16
2024-05-16
2024-05-16
2024-05-16
2024-05-16
2024-05-16
2024-05-16
回答
回答
回答
回答
回答
回答
回答
回答
回答
回答


官方手机版

微信公众号

商务合作


0