本篇内容主要讲解“基于Echarts如何实现绘制立体柱状图”,感兴趣的朋友不妨来看看。本文介绍的方法操作简单快捷,实用性强。下面就让小编来带大家学习“基于Echarts如何实现绘制立体柱状图”吧!实现方法先写一个常规的柱状图在这个基础上进行
本篇内容主要讲解“基于Echarts如何实现绘制立体柱状图”,感兴趣的朋友不妨来看看。本文介绍的方法操作简单快捷,实用性强。下面就让小编来带大家学习“基于Echarts如何实现绘制立体柱状图”吧!

在这个基础上进行改进
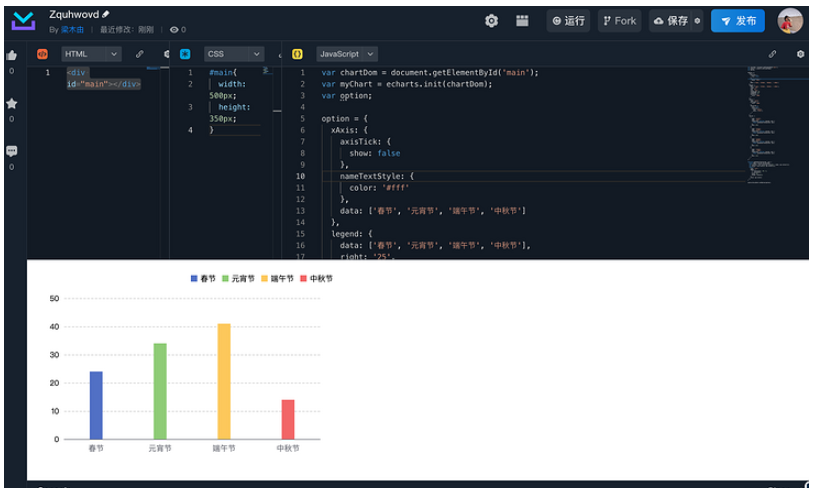
<div id="main"></div>#main{ width: 500px; height: 350px;}var chartDom = document.getElementById('main');var myChart = echarts.init(chartDom);var option;option = { xAxis: { axisTick: { show: false }, nameTextStyle: { color: '#fff' }, data: ['春节', '元宵节', '端午节', '中秋节'] }, legend: { data: ['春节', '元宵节', '端午节', '中秋节'], right: '25', top: '18', icon: 'rect', itemHeight: 10, itemWidth: 10, textStyle: { color: '#000' } }, yAxis: { type: 'value', axisLabel: { color: '#000' }, splitLine: { show: true, lineStyle: { type: 'dashed', color: ['#ccc'] } } }, series: [ { data: [ { name: '春节', value: 24 }, { name: '端午节', value: 44 }, { name: '中秋节', value: 32 }, { name: '春节', value: 50 } ], barWidth: 30, type: 'bar' } ]};option && myChart.setOption(option);首先呢我们看下echarts的配置选项
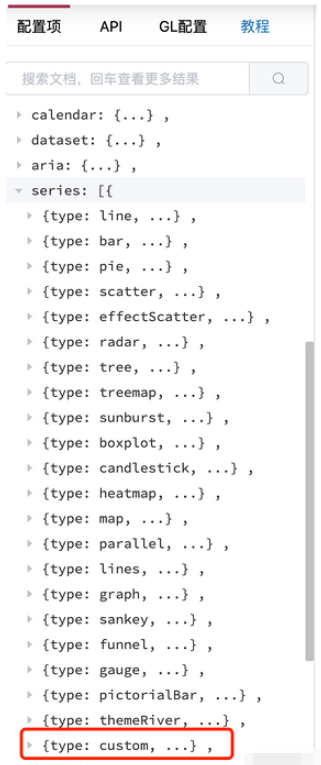
那我们看所有的type 没有立体柱状图的类型,但是呢我们看最后一项type: custom,什么意思呢,自定义系列,那就是说我们可以选择custom 类型来实现立体柱状图
renderItem
type为custom可以自定义系列图形元素渲染。
根据查看配置项,发现有一个renderItem函数,custom 系列需要开发者自己提供图形渲染的逻辑。这个渲染逻辑一般命名为 renderItem
看下renderItem函数的介绍
renderItem 函数提供了两个参数:
params:包含了当前数据信息和坐标系的信息。
{ context: // {Object} 一个可供开发者暂存东西的对象。生命周期只为:当前次的渲染。 seriesId: // {string} 本系列 id。 seriesName: // {string} 本系列 name。 seriesIndex: // {number} 本系列 index。 dataIndex: // {number} 数据项的 index。 dataIndexInside: // {number} 数据项在当前坐标系中可见的数据的 index(即 dataZoom 当前窗口中的数据的 index)。 dataInsideLength: // {number} 当前坐标系中可见的数据长度(即 dataZoom 当前窗口中的数据数量)。 actionType: // {string} 触发此次重绘的 action 的 type。 coordSys: // 不同的坐标系中,coordSys 里的信息不一样,含有如下这些可能: coordSys: { type: 'cartesian2d', x: // {number} grid rect 的 x y: // {number} grid rect 的 y width: // {number} grid rect 的 width height: // {number} grid rect 的 height }, coordSys: { type: 'calendar', x: // {number} calendar rect 的 x y: // {number} calendar rect 的 y width: // {number} calendar rect 的 width height: // {number} calendar rect 的 height cellWidth: // {number} calendar cellWidth cellHeight: // {number} calendar cellHeight rangeInfo: { start: // calendar 日期开端 end: // calendar 日期结尾 weeks: // calendar 周数 dayCount: // calendar 日数 } }, coordSys: { type: 'geo', x: // {number} geo rect 的 x y: // {number} geo rect 的 y width: // {number} geo rect 的 width height: // {number} geo rect 的 height zoom: // {number} 缩放的比率。如果没有缩放,则值为 1。例如 0.5 表示缩小了一半。 }, coordSys: { type: 'polar', cx: // {number} polar 的中心坐标 cy: // {number} polar 的中心坐标 r: // {number} polar 的外半径 r0: // {number} polar 的内半径 }, coordSys: { type: 'singleAxis', x: // {number} singleAxis rect 的 x y: // {number} singleAxis rect 的 y width: // {number} singleAxis rect 的 width height: // {number} singleAxis rect 的 height }}其中,关于 dataIndex 和 dataIndexInside 的区别:
dataIndex 指的 dataItem 在原始数据中的 index。
dataIndexInside 指的是 dataItem 在当前数据窗口中的 index。
[renderItem.arguments.api] 中使用的参数都是 dataIndexInside 而非 dataIndex,因为从 dataIndex 转换成 dataIndexInside 需要时间开销。
api:是一些开发者可调用的方法集合。
所有属性
{[value], [coord] , [size] , [style] , [styleEmphasis] , [visual] , [barLayout] , [currentSeriesIndices] , [font], [getWidth] , [getHeight], [getZr], [getDevicePixelRatio]}
我们使用renderItem来自定义元素会使用到renderItem.api的三个方法,先来介绍下这三个方法
[api.value(...)],意思是取出 dataItem 中的数值。例如 api.value(0) 表示取出当前 dataItem 中第一个维度的数值。
[api.coord(...)],意思是进行坐标转换计算。例如 var point = api.coord([api.value(0), api.value(1)]) 表示 dataItem 中的数值转换成坐标系上的点。
[api.size(...)] ,表示得到坐标系上一段数值范围对应的长度。
看下代码实现
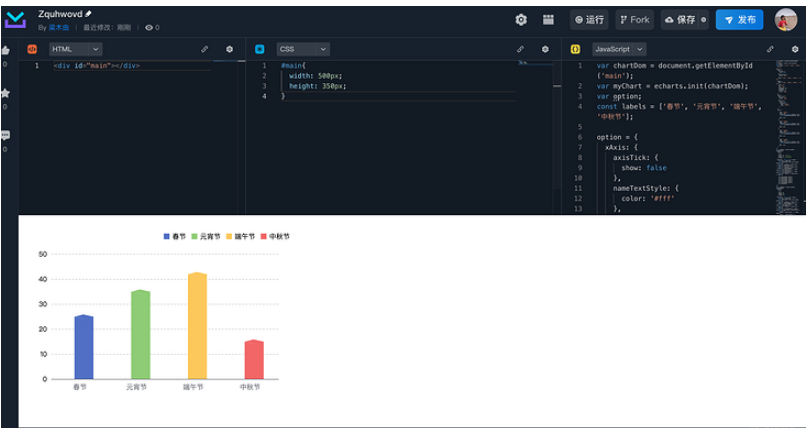
series: getSeriesData()function getSeriesData() { const data = []; seriesData.forEach((item, index) => { data.push( { type: 'custom', name: item.label, renderItem: function (params, api) { return getRenderItem(params, api); }, data: item.value, } ) }) return data}function getRenderItem(params, api) { // params.seriesIndex表示本系列 index const index = params.seriesIndex; // api.coord() 坐标转换计算 // api.value() 取出当前项中的数值 let location = api.coord([api.value(0) + index, api.value(1)]); // api.size() 坐标系数值范围对应的长度 var extent = api.size([0, api.value(1)]); return { type: 'rect', shape: { x: location[0] - 20 / 2, y: location[1], width: 20, height: extent[1] }, style: api.style() };}来看下我们的实现效果
柱状图效果出来了,那来看下怎么将柱状图改为立体图
return_group
我看到renderItem可以返回一个return_group类型,来看看这个类型的介绍
group 是唯一的可以有子节点的容器。
group 可以用来整体定位一组图形元素。
那就是说我们可以将设定一组图形元素然后组合到一起形成立体柱状图
那么问题又来了怎么设定一组图形元素呢?
graphic
这个呢是关于图形相关的方法,再来了解两个API
graphic.extendShape
创建一个新的图形元素
graphic.registerShape
注册一个开发者定义的图形元素
创建图形元素
那我们先来创建一个新的图形元素
const leftRect = echarts.graphic.extendShape({ shape: { x: 0, y: 0, width: 19, //柱状图宽 zWidth: 8, //阴影折角宽 zHeight: 4, //阴影折角高 }, buildPath: function (ctx, shape) { const api = shape.api; const xAxisPoint = api.coord([shape.xValue, 0]); const p0 = [shape.x - shape.width / 2, shape.y - shape.zHeight]; const p1 = [shape.x - shape.width / 2, shape.y - shape.zHeight]; const p2 = [xAxisPoint[0] - shape.width / 2, xAxisPoint[1]]; const p3 = [xAxisPoint[0] + shape.width / 2, xAxisPoint[1]]; const p4 = [shape.x + shape.width / 2, shape.y]; ctx.moveTo(p0[0], p0[1]); ctx.lineTo(p1[0], p1[1]); ctx.lineTo(p2[0], p2[1]); ctx.lineTo(p3[0], p3[1]); ctx.lineTo(p4[0], p4[1]); ctx.lineTo(p0[0], p0[1]); ctx.closePath(); }, });const rightRect = echarts.graphic.extendShape({ shape: { x: 0, y: 0, width: 18, zWidth: 15, zHeight: 8, }, buildPath: function (ctx, shape) { const api = shape.api; const xAxisPoint = api.coord([shape.xValue, 0]); const p1 = [shape.x - shape.width / 2, shape.y - shape.zHeight / 2]; const p3 = [xAxisPoint[0] + shape.width / 2, xAxisPoint[1]]; const p4 = [shape.x + shape.width / 2, shape.y]; const p5 = [xAxisPoint[0] + shape.width / 2 + shape.zWidth, xAxisPoint[1]]; const p6 = [shape.x + shape.width / 2 + shape.zWidth, shape.y - shape.zHeight / 2]; const p7 = [shape.x - shape.width / 2 + shape.zWidth, shape.y - shape.zHeight]; ctx.moveTo(p4[0], p4[1]); ctx.lineTo(p3[0], p3[1]); ctx.lineTo(p5[0], p5[1]); ctx.lineTo(p6[0], p6[1]); ctx.lineTo(p4[0], p4[1]); ctx.moveTo(p4[0], p4[1]); ctx.lineTo(p6[0], p6[1]); ctx.lineTo(p7[0], p7[1]); ctx.lineTo(p1[0], p1[1]); ctx.lineTo(p4[0], p4[1]); ctx.closePath(); }, });注册图形元素
echarts.graphic.reGISterShape('leftRect', leftRect);echarts.graphic.registerShape('rightRect', rightRect);再来修改一下return_group
function getRenderItem(params, api) { const index = params.seriesIndex; let location = api.coord([api.value(0) + index, api.value(1)]); var extent = api.size([0, api.value(1)]); return { type: 'group', children: [ { type: 'leftRect', shape: { api, xValue: api.value(0) + index, yValue: api.value(1), x: location[0], y: location[1] }, style: api.style() }, { type: 'rightRect', shape: { api, xValue: api.value(0) + index, yValue: api.value(1), x: location[0], y: location[1] }, style: api.style() } ] };}再来看下效果
可以看到立体形状的柱状图已经实现了,那还有个缺点就是颜色需要再按照设计图来改改
const colors = [ [ { offset: 0, color: 'rgba(26, 132, 191, 1)' }, { offset: 1, color: 'rgba(52, 163, 224, 0.08)' }, ], [ { offset: 0, color: 'rgba(137, 163, 164, 1)' }, { offset: 1, color: 'rgba(137, 163, 164, 0.08)' }, ], [ { offset: 0, color: 'rgba(44, 166, 166, 1)' }, { offset: 1, color: 'rgba(44, 166, 166, 0.08)' }, ], [ { offset: 0, color: 'rgba(34, 66, 186, 1)' }, { offset: 1, color: 'rgba(34, 66, 186, 0.08)' }, ], ];//在getSeriesData添加itemStyleitemStyle: { color: () => { return new echarts.graphic.LinearGradient(0, 0, 0, 1, colors[index]); },},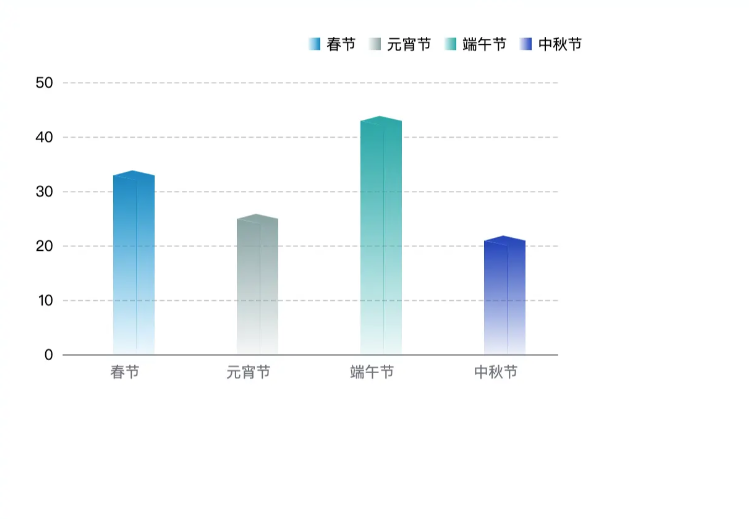
到此,相信大家对“基于Echarts如何实现绘制立体柱状图”有了更深的了解,不妨来实际操作一番吧!这里是编程网网站,更多相关内容可以进入相关频道进行查询,关注我们,继续学习!
--结束END--
本文标题: 基于Echarts如何实现绘制立体柱状图
本文链接: https://www.lsjlt.com/news/349857.html(转载时请注明来源链接)
有问题或投稿请发送至: 邮箱/279061341@qq.com QQ/279061341
下载Word文档到电脑,方便收藏和打印~
2024-05-16
2024-05-16
2024-05-16
2024-05-16
2024-05-16
2024-05-16
2024-05-16
2024-05-16
2024-05-16
2024-05-16
回答
回答
回答
回答
回答
回答
回答
回答
回答
回答


官方手机版

微信公众号

商务合作


0