Python 官方文档:入门教程 => 点击学习
如有错误,恳请指出。 在本地上,可以安装一些软件,比如:Meshlab,CloudCompare等3D查看工具来对点云进行可视化。而这篇博客是将介绍一些代码工具将KITTI数据集进行可视化操作,包
如有错误,恳请指出。
在本地上,可以安装一些软件,比如:Meshlab,CloudCompare等3D查看工具来对点云进行可视化。而这篇博客是将介绍一些代码工具将KITTI数据集进行可视化操作,包括点云鸟瞰图,FOV图,以及标注信息在图像+点云上的显示。
KITTI数据集作为自动驾驶领域的经典数据集之一,比较适合我这样的新手入门。以下资料是为了实现对KITTI数据集的可视化操作。首先在官网下载对应的数据:Http://www.cvlibs.net/datasets/kitti/eval_object.PHP?obj_benchmark=3d,下载后数据的目录文件结构如下所示:
├── dataset│ ├── KITTI│ │ ├── object│ │ │ ├──KITTI│ │ │ ├──ImageSets│ │ │ ├──training│ │ │ ├──calib & velodyne & label_2 & image_2这里使用了一个kitti数据集可视化的开源代码:https://GitHub.com/kuixu/kitti_object_vis,按照以下操作新建一个虚拟环境,并安装所需的工具包。其中千万不要安装python3.7以上的版本,因为vtk不支持。
# 新建python=3.7的虚拟环境conda create -n kitti_vis Python=3.7 # vtk does not support python 3.8conda activate kitti_vis# 安装OpenCV, pillow, scipy, matplotlib工具包pip install opencv-python pillow scipy matplotlib# 安装3D可视化工具包(以下指令会自动安转所需的vtk与pyQt5)conda install mayavi -c conda-forge# 测试python kitti_object.py --show_lidar_with_depth --img_fov --const_box --vis下面依次展示 KITTI 数据集可视化结果,这里通过设置 data_idx=10 来展示编号为000010的数据,代码中dataset需要修改为数据集实际路径。(最后会贴上完整代码)
def visualization(): import mayavi.mlab as mlab dataset = kitti_object(os.path.join(ROOT_DIR, '../dataset/KITTI/object')) # determine data_idx data_idx = 100 # Load data from dataset objects = dataset.get_label_objects(data_idx) print("There are %d objects.", len(objects)) img = dataset.get_image(data_idx) img = cv2.cvtColor(img, cv2.COLOR_BGR2RGB) img_height, img_width, img_channel = img.shape pc_velo = dataset.get_lidar(data_idx)[:,0:3] calib = dataset.get_calibration(data_idx) 代码来源于参考资料,在后面会贴上我自己修改的测试代码。以下包含9种可视化的操作:
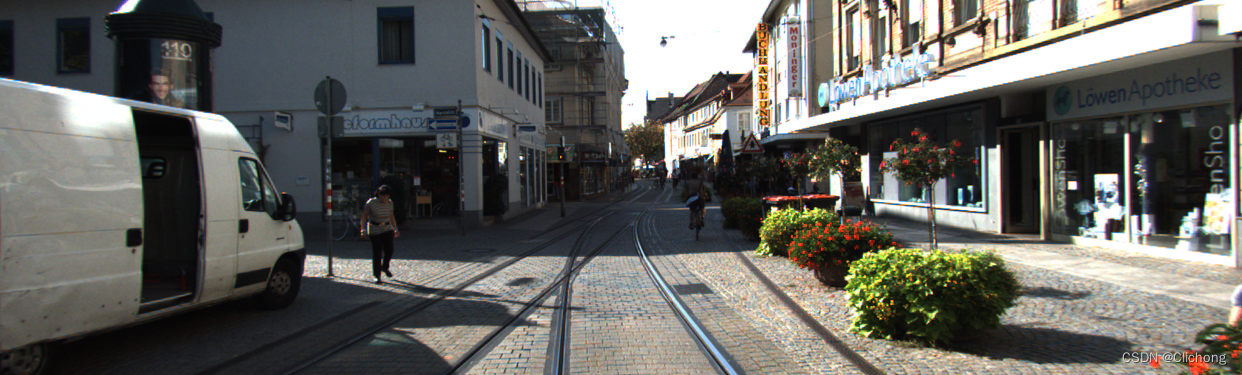
def show_image(self): Image.fromarray(self.img).show() cv2.waiTKEy(0)结果展示:
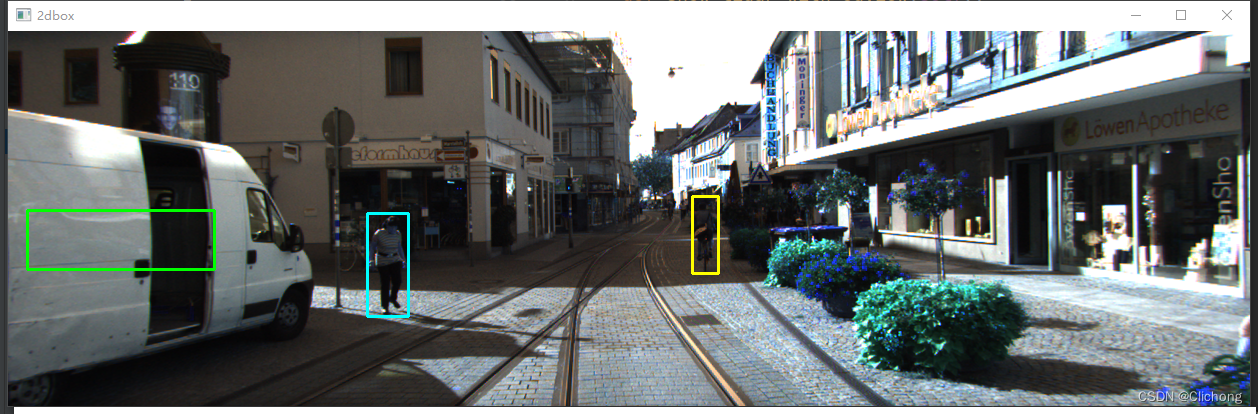
def show_image_with_2d_boxes(self): show_image_with_boxes(self.img, self.objects, self.calib, show3d=False) cv2.waitKey(0)结果展示:
def show_image_with_3d_boxes(self): show_image_with_boxes(self.img, self.objects, self.calib, show3d=True) cv2.waitKey(0)结果展示:

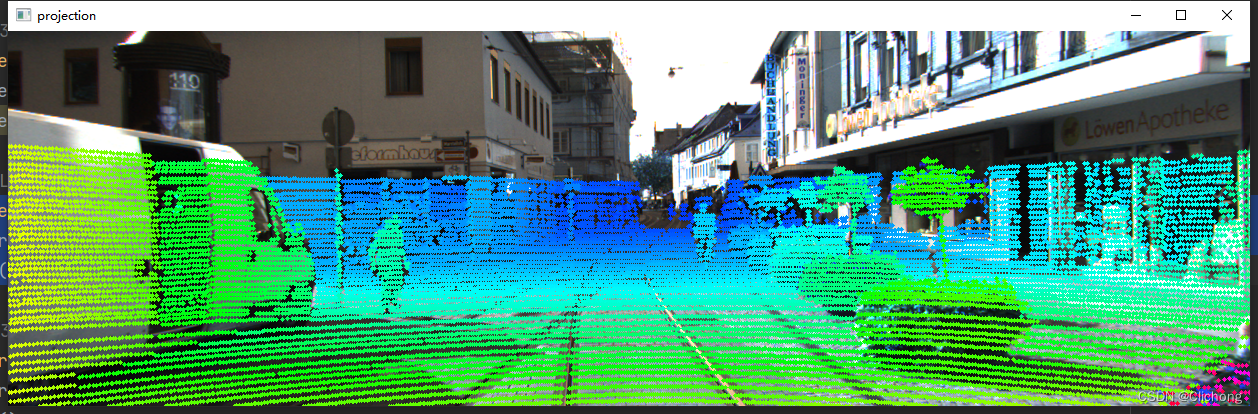
def show_image_with_lidar(self): show_lidar_on_image(self.pc_velo, self.img, self.calib, self.img_width, self.img_height) mlab.show()结果展示:
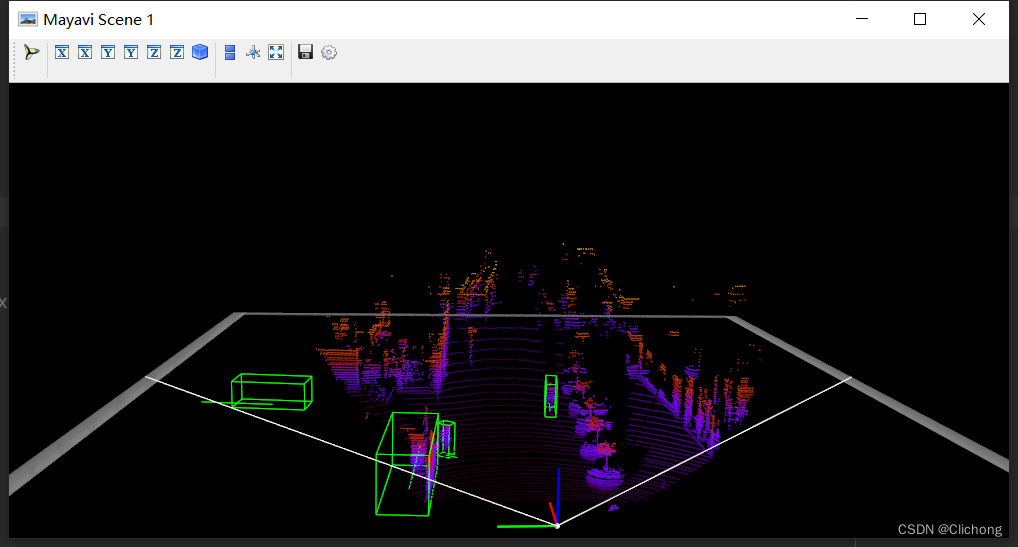
def show_lidar_with_3d_boxes(self): show_lidar_with_boxes(self.pc_velo, self.objects, self.calib, True, self.img_width, self.img_height) mlab.show()结果展示:
def show_lidar_with_fov(self): imgfov_pc_velo, pts_2d, fov_inds = get_lidar_in_image_fov(self.pc_velo, self.calib, 0, 0, self.img_width, self.img_height, True) draw_lidar(imgfov_pc_velo) mlab.show()结果展示:
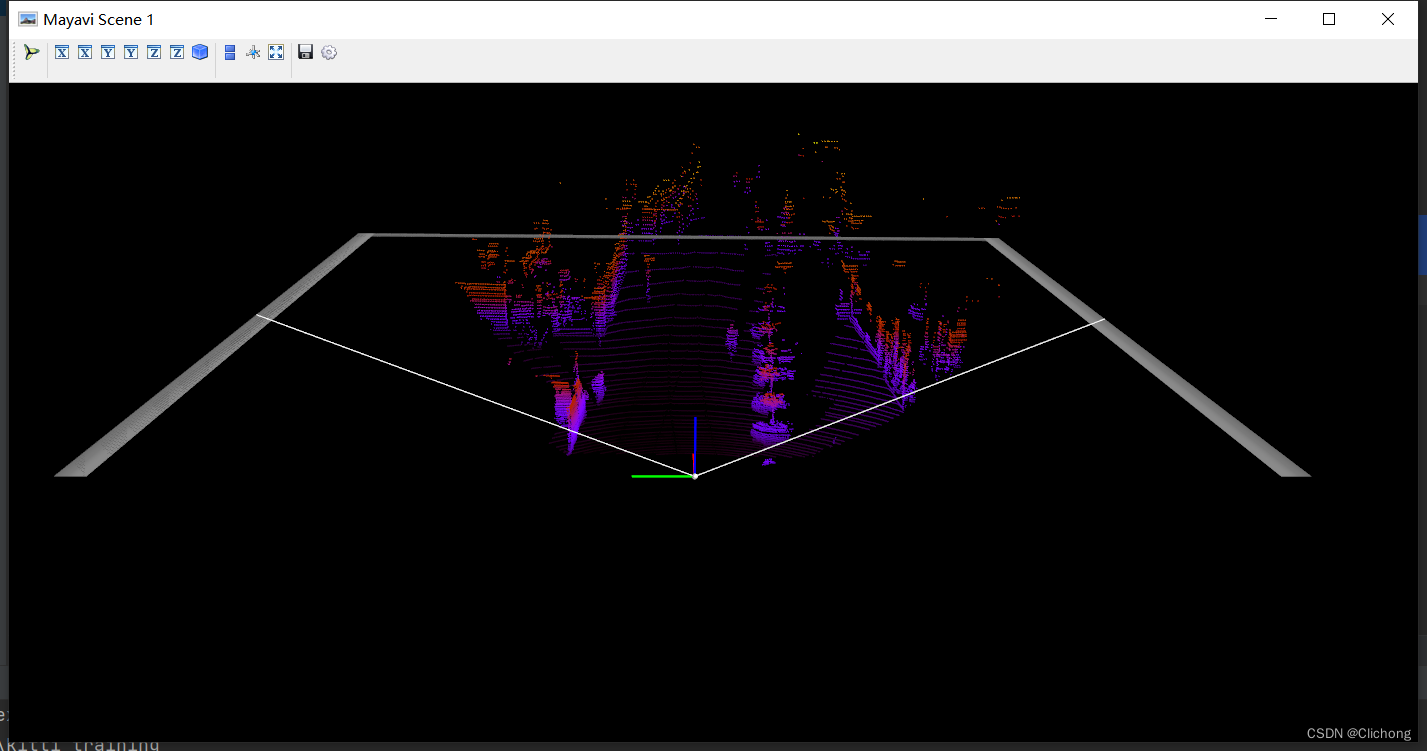
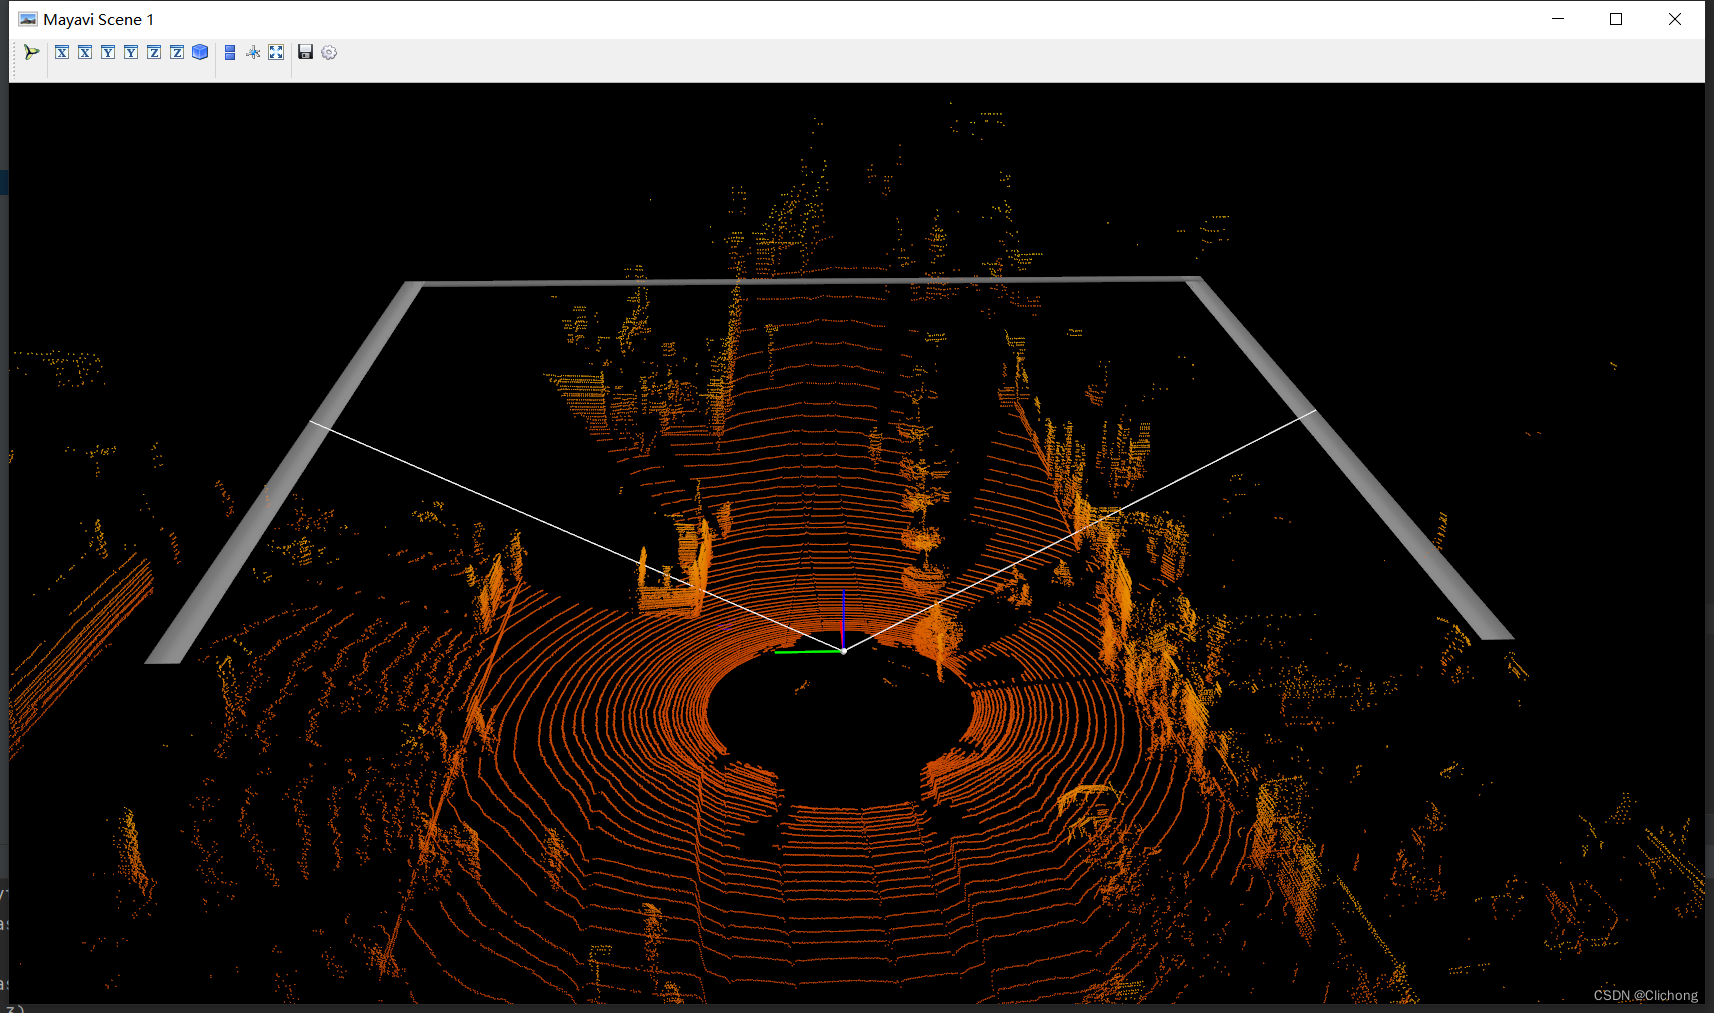
def show_lidar_with_3dview(self): draw_lidar(self.pc_velo) mlab.show()结果展示:
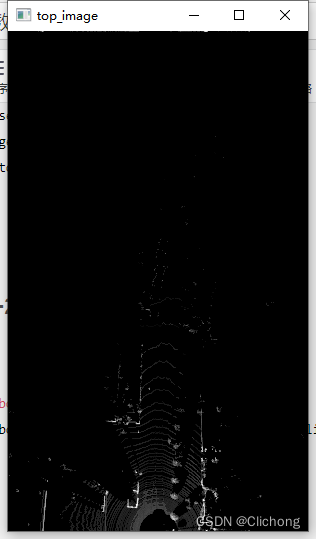
BEV图的显示与其他视图不一样,这里的代码需要有点改动,因为这里需要lidar点云的其他维度信息,所以输入不仅仅是xyz三个维度。改动代码:
# 初始pc_velo = dataset.get_lidar(data_idx)[:, 0:3]# 改为(要增加其他维度才可以查看BEV视图)pc_velo = dataset.get_lidar(data_idx)[:, 0:4]测试代码:
def show_lidar_with_bev(self): from kitti_util import draw_top_image, lidar_to_top top_view = lidar_to_top(self.pc_velo) top_image = draw_top_image(top_view) cv2.imshow("top_image", top_image) cv2.waitKey(0)结果展示:
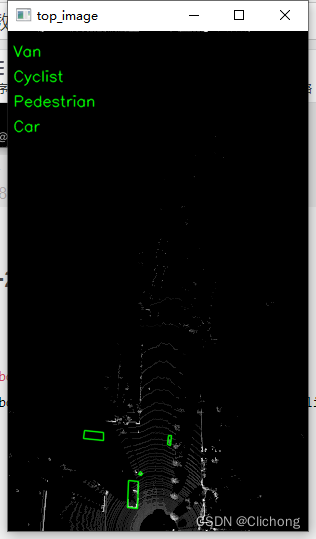
同样,这里的代码改动与3.8节一样,需要点云的其他维度信息
def show_lidar_with_bev_2d_bbox(self): show_lidar_topview_with_boxes(self.pc_velo, self.objects, self.calib) mlab.show()结果展示:
参考代码:
import mayavi.mlab as mlabfrom kitti_object import kitti_object, show_image_with_boxes, show_lidar_on_image, \ show_lidar_with_boxes, show_lidar_topview_with_boxes, get_lidar_in_image_fov, \ show_lidar_with_depthfrom viz_util import draw_lidarimport cv2from PIL import Imageimport timeclass visualization: # data_idx: determine data_idx def __init__(self, root_dir=r'E:\Study\Machine Learning\Dataset3d\kitti', data_idx=100): dataset = kitti_object(root_dir=root_dir) # Load data from dataset objects = dataset.get_label_objects(data_idx) print("There are {} objects.".fORMat(len(objects))) img = dataset.get_image(data_idx) img = cv2.cvtColor(img, cv2.COLOR_BGR2RGB) img_height, img_width, img_channel = img.shape pc_velo = dataset.get_lidar(data_idx)[:, 0:3] # 显示bev视图需要改动为[:, 0:4] calib = dataset.get_calibration(data_idx) # init the params self.objects = objects self.img = img self.img_height = img_height self.img_width = img_width self.img_channel = img_channel self.pc_velo = pc_velo self.calib = calib # 1. 图像显示 def show_image(self): Image.fromarray(self.img).show() cv2.waitKey(0) # 2. 图片上绘制2D bbox def show_image_with_2d_boxes(self): show_image_with_boxes(self.img, self.objects, self.calib, show3d=False) cv2.waitKey(0) # 3. 图片上绘制3D bbox def show_image_with_3d_boxes(self): show_image_with_boxes(self.img, self.objects, self.calib, show3d=True) cv2.waitKey(0) # 4. 图片上绘制Lidar投影 def show_image_with_lidar(self): show_lidar_on_image(self.pc_velo, self.img, self.calib, self.img_width, self.img_height) mlab.show() # 5. Lidar绘制3D bbox def show_lidar_with_3d_boxes(self): show_lidar_with_boxes(self.pc_velo, self.objects, self.calib, True, self.img_width, self.img_height) mlab.show() # 6. Lidar绘制FOV图 def show_lidar_with_fov(self): imgfov_pc_velo, pts_2d, fov_inds = get_lidar_in_image_fov(self.pc_velo, self.calib, 0, 0, self.img_width, self.img_height, True) draw_lidar(imgfov_pc_velo) mlab.show() # 7. Lidar绘制3D图 def show_lidar_with_3dview(self): draw_lidar(self.pc_velo) mlab.show() # 8. Lidar绘制BEV图 def show_lidar_with_bev(self): from kitti_util import draw_top_image, lidar_to_top top_view = lidar_to_top(self.pc_velo) top_image = draw_top_image(top_view) cv2.imshow("top_image", top_image) cv2.waitKey(0) # 9. Lidar绘制BEV图+2D bbox def show_lidar_with_bev_2d_bbox(self): show_lidar_topview_with_boxes(self.pc_velo, self.objects, self.calib) mlab.show()if __name__ == '__main__': kitti_vis = visualization() # kitti_vis.show_image() # kitti_vis.show_image_with_2d_boxes() # kitti_vis.show_image_with_3d_boxes() # kitti_vis.show_image_with_lidar() # kitti_vis.show_lidar_with_3d_boxes() # kitti_vis.show_lidar_with_fov() # kitti_vis.show_lidar_with_3dview() # kitti_vis.show_lidar_with_bev() kitti_vis.show_lidar_with_bev_2d_bbox() # print('...') # cv2.waitKey(0)此外,下面再提供两份可视化代码。
这里的同样使用的是上述的图例,且直接输入的KITTI数据集的.bin文件,即可显示点云图像。
import numpy as npimport mayavi.mlabimport os# 000010.bin这里需要填写文件的位置# bin_file = '../data/object/training/velodyne/000000.bin'# assert os.path.exists(bin_file), "{} is not exists".format(bin_file)kitti_file = r'E:\Study\Machine Learning\Dataset3d\kitti\training\velodyne\000100.bin'pointcloud = np.fromfile(file=kitti_file, dtype=np.float32, count=-1).reshape([-1, 4])# pointcloud = np.fromfile(str("000010.bin"), dtype=np.float32, count=-1).reshape([-1, 4])print(pointcloud.shape)x = pointcloud[:, 0] # x position of pointy = pointcloud[:, 1] # y position of pointz = pointcloud[:, 2] # z position of pointr = pointcloud[:, 3] # reflectance value of pointd = np.sqrt(x ** 2 + y ** 2) # Map Distance from sensorvals = 'height'if vals == "height": col = zelse: col = dfig = mayavi.mlab.figure(bGColor=(0, 0, 0), size=(640, 500))mayavi.mlab.points3d(x, y, z, col, # Values used for Color mode="point", colormap='spectral', # 'bone', 'copper', 'gnuplot' # color=(0, 1, 0), # Used a fixed (r,g,b) instead figure=fig, )x = np.linspace(5, 5, 50)y = np.linspace(0, 0, 50)z = np.linspace(0, 5, 50)mayavi.mlab.plot3d(x, y, z)mayavi.mlab.show()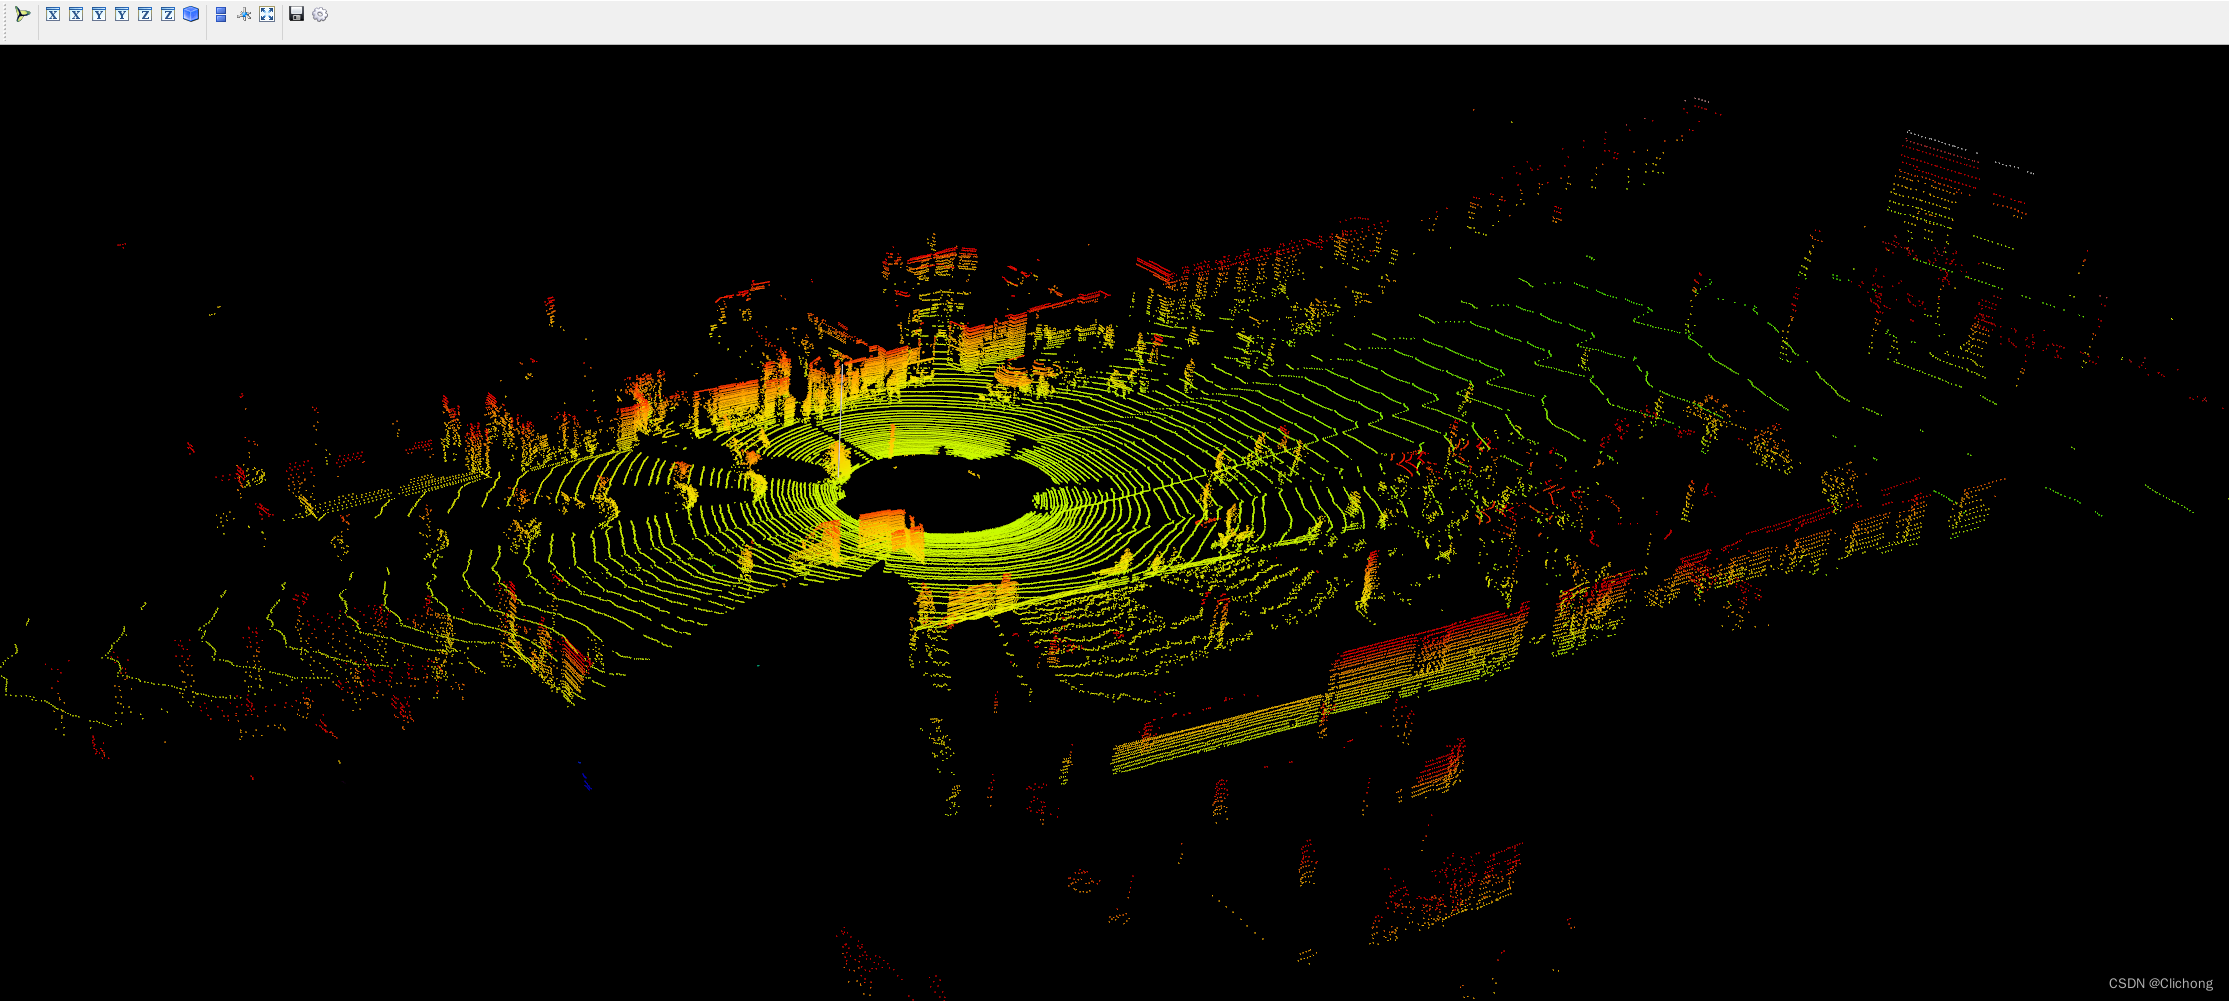
ps:这里的输出点云结果相比上面的点云输出结果更加的完善,而且参考的中心坐标点也不一样。
代码中的鸟瞰图范围可以自行设置。同样,输入的也只需要是.bin文件即可展示其鸟瞰图。
import numpy as npfrom PIL import Imageimport matplotlib.pyplot as plt# 点云读取:000010.bin这里需要填写文件的位置kitti_file = r'E:\Study\Machine Learning\Dataset3d\kitti\training\velodyne\000100.bin'pointcloud = np.fromfile(file=kitti_file, dtype=np.float32, count=-1).reshape([-1, 4])# 设置鸟瞰图范围side_range = (-40, 40) # 左右距离# fwd_range = (0, 70.4) # 后前距离fwd_range = (-70.4, 70.4)x_points = pointcloud[:, 0]y_points = pointcloud[:, 1]z_points = pointcloud[:, 2]# 获得区域内的点f_filt = np.logical_and(x_points > fwd_range[0], x_points < fwd_range[1])s_filt = np.logical_and(y_points > side_range[0], y_points < side_range[1])filter = np.logical_and(f_filt, s_filt)indices = np.argwhere(filter).flatten()x_points = x_points[indices]y_points = y_points[indices]z_points = z_points[indices]res = 0.1 # 分辨率0.05mx_img = (-y_points / res).astype(np.int32)y_img = (-x_points / res).astype(np.int32)# 调整坐标原点x_img -= int(np.floor(side_range[0]) / res)y_img += int(np.floor(fwd_range[1]) / res)print(x_img.min(), x_img.max(), y_img.min(), x_img.max())# 填充像素值height_range = (-2, 0.5)pixel_value = np.clip(a=z_points, a_max=height_range[1], a_min=height_range[0])def scale_to_255(a, min, max, dtype=np.uint8): return ((a - min) / float(max - min) * 255).astype(dtype)pixel_value = scale_to_255(pixel_value, height_range[0], height_range[1])# 创建图像数组x_max = 1 + int((side_range[1] - side_range[0]) / res)y_max = 1 + int((fwd_range[1] - fwd_range[0]) / res)im = np.zeros([y_max, x_max], dtype=np.uint8)im[y_img, x_img] = pixel_value# imshow (灰度)im2 = Image.fromarray(im)im2.show()# imshow (彩色)# plt.imshow(im, cmap="nipy_spectral", vmin=0, vmax=255)# plt.show()
后续的工作会加深对点云数据的理解,整个可视化项目的工程见:KITTI数据集的可视化项目,有需要的朋友可以自行下载。
参考资料:
3. kitti数据集在3D目标检测中的入门(二)可视化详解
来源地址:https://blog.csdn.net/weixin_44751294/article/details/127345052
--结束END--
本文标题: KITTI数据集可视化(一):点云多种视图的可视化实现
本文链接: https://www.lsjlt.com/news/411397.html(转载时请注明来源链接)
有问题或投稿请发送至: 邮箱/279061341@qq.com QQ/279061341
下载Word文档到电脑,方便收藏和打印~
2024-03-01
2024-03-01
2024-03-01
2024-02-29
2024-02-29
2024-02-29
2024-02-29
2024-02-29
2024-02-29
2024-02-29
回答
回答
回答
回答
回答
回答
回答
回答
回答
回答


官方手机版

微信公众号

商务合作


0